A training manager opens the quarterly dashboard. Completion sits at 96%. Learner satisfaction averages 4.7 out of 5. The assessment pass rate is 92%. By every number on the screen, the programme worked.
Then someone in the room asks the only question that actually matters: did anything change after the training?
Nobody has a confident answer. The dashboard is full of activity. It is nearly empty of insight.
That gap is where learning analytics becomes useful — not by adding more charts, but by changing which questions get asked in the first place. Most organisations already collect training data. Attendance, scores, survey ratings, LMS logs — it’s there. What’s usually missing is a disciplined way of turning that data into decisions about content, coaching, and where to invest L&D effort next.
If you’re new to this, you don’t need a statistics background or a data science team to start. You need a clearer question than “how many people completed the course,” and a habit of following the data toward what it actually implies about behaviour and performance.
What Is Learning Analytics in L&D?
SoLAR describes learning analytics as the collection, analysis, interpretation and communication of data about learners and their learning, aimed at understanding and improving learning and the environments in which it happens. That’s the formal definition worth knowing.
For an L&D practitioner, however, the real value of learning analytics begins when the analysis changes a decision. A report that gets generated, admired, and filed away without altering a single choice about the programme isn’t doing much practical work yet — even if it technically qualifies as analysis.
A useful way to hold the concept in your head is a simple chain:
Data → Insight → Decision → Action → Outcome
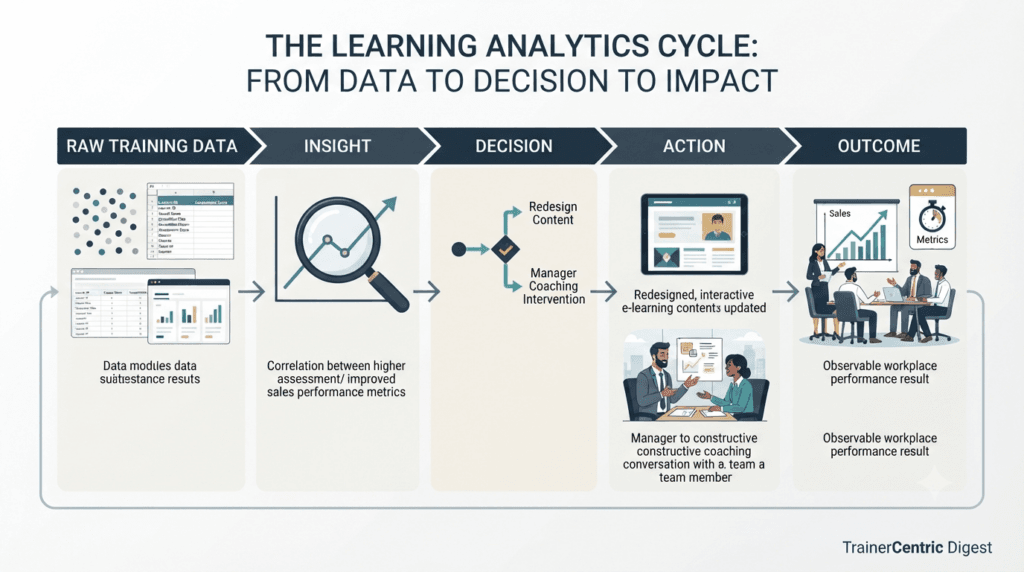
Take a simple example. A compliance course shows a 40% failure rate on one specific assessment question, concentrated among warehouse staff on the night shift. That’s a data point. The insight is that the content or delivery method isn’t landing with that group specifically — not that “the course is too hard.”
The decision might be to redesign that section with a shift-relevant scenario, or to add supervisor reinforcement on the floor. The action is made, and the outcome — re-tested performance — tells you whether the fix worked. That whole loop, not the failure rate on its own, is where learning analytics earns its keep.
Learning Analytics, Measurement and Evaluation: How They Fit Together
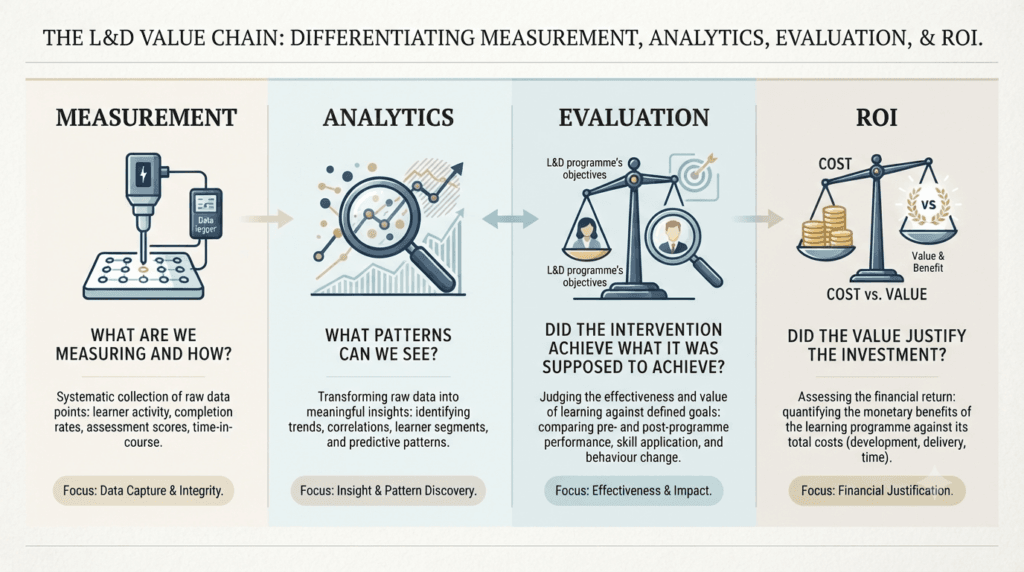
Beginners often meet four terms at once — measurement, analytics, evaluation, ROI — and are never quite told how they relate. They’re not synonyms, and they’re not a strict sequence either. They’re four different questions applied to the same underlying data:
| Discipline | Core Question |
| Measurement | What are we measuring, and how? |
| Analytics | What patterns can we see in the data? |
| Evaluation | Did the intervention achieve what it was supposed to achieve? |
| ROI | Did the value justify the investment? |
Measurement is where the process starts: deciding what to measure, how to measure it, and what the resulting data actually represents. Analytics is what you do with that data day to day, spotting patterns before you’ve made any judgement about success. Evaluation is a more formal judgement, usually tied to a specific programme’s objectives, and is where the Kirkpatrick Model for evaluating training effectiveness does its work. ROI goes one step further again, translating evaluation evidence into a financial argument — the territory covered in calculating and presenting training ROI and the Phillips ROI Model.
Treat them as a loose map, not a checklist to complete in order. In practice, most L&D teams move back and forth between analytics and evaluation constantly — a diagnostic pattern noticed through analytics often becomes the trigger for a more formal evaluation of a specific programme.
Why Does Learning Analytics Matter for L&D Professionals?
Most L&D functions are already good at activity reporting. Far fewer are set up to do decision-support analytics — and the difference between the two explains why so much training data goes unused.
Activity reporting looks like this:
- 800 learners enrolled
- 760 completed
- Average score: 86%
- Satisfaction: 4.5 / 5
Analytics asks different questions:
- Which learners struggled, and where specifically did they struggle?
- Did performance actually improve after the programme?
- Which behaviours changed on the job?
- Which groups benefited most — and which barely moved?
- Where is additional support genuinely needed?
- Did the programme address the original performance problem it was built for?
Reporting tells you what happened. Analytics is the discipline of figuring out what it means.
Learning Analytics Basics for Corporate Trainers
Most introductions to analytics borrow four categories from broader data practice. They translate cleanly into L&D terms, and beginners genuinely only need to feel comfortable with the first two.
| Type | Question It Answers | Sales Training Example |
| Descriptive | What happened? | Assessment scores fell 12% this quarter. |
| Diagnostic | Why did it happen? | Most errors cluster around objection-handling questions. |
| Predictive | What might happen next? | New hires may keep struggling without intervention. |
| Prescriptive | What should we do about it? | Add targeted practice and manager coaching on objections. |
| A guardrail on predictive analytics Genuine predictive analytics normally needs sufficient historical data, well-chosen variables, a validated model, and careful interpretation. Noticing a trend in your LMS dashboard and guessing what happens next is a reasonable hunch — it isn’t the same discipline, and it’s worth not calling it that internally. Beginners should start with descriptive and diagnostic analytics. That’s where most of the practical value sits before a team has the infrastructure for anything more rigorous. |
What Data Can L&D Actually Analyse?
More data does not automatically mean better analytics. The usefulness of any metric depends entirely on the question it’s being asked to answer.
| Data Type | Examples | What It Can Tell You |
| Participation data | Enrolment, attendance, completion | Engagement |
| Assessment data | Scores, attempts, question-level performance | Knowledge and skill gaps |
| Behaviour data | Manager observations, on-the-job application | Transfer of learning |
| Performance data | Productivity, quality, errors, sales figures | Business and performance outcomes |
| Feedback data | Surveys, open comments | Learner experience |
| Operational data | Cost, time, resource utilisation | Programme efficiency |
A faster way to decide where to start: match the data to the question, not the other way around.
| If Your Question Is… | Start With… |
| Did people participate? | Attendance / completion data |
| Did they learn? | Assessment or performance-task results |
| Did they retain it? | A delayed knowledge check |
| Did behaviour change? | Manager observation / application data |
| Did performance change? | Business or performance data |
| Was it worth the investment? | Cost data plus outcome data |
Key Metrics in Learning Analytics for L&D
A beginner doesn’t need to track everything on this list at once. What matters is knowing which category a metric belongs to, so it gets weighed appropriately rather than treated as proof of something it can’t actually prove.
| Category | Beginner-Friendly Metrics |
| Activity metrics | Completion rate, attendance, time spent, participation |
| Learning metrics | Assessment performance, question-level results, repeat attempts, knowledge retention |
| Behaviour metrics | Manager observations, application of skills, confidence/self-assessment |
| Business metrics | Performance outcomes, quality, error rates, cost-related measures |
Activity metrics vs learning metrics vs behaviour metrics vs business metrics is a distinction worth keeping visible on every dashboard you build — treating them as interchangeable evidence of “success” is where most learning measurement goes wrong. Once a team is comfortable with the categories, the natural next steps are understanding which measures are leading and lagging indicators [internal link” Leading vs Lagging Learning Metrics”], and building them into a working set of learning KPIs [internal link” Learning KPIs Every L&D Manager Should Track” ] the whole team tracks consistently.
Benefits of Learning Analytics in L&D
Each of these should connect to a decision, not just a nicer-looking report:
Better training decisions — redesign, retire or reinforce content based on where learners actually struggle, not on instinct.
Earlier identification of gaps — question-level assessment data flags weak spots before they show up as performance problems.
More targeted interventions — coaching and follow-up support go to the people and modules that need it, not everyone equally.
Stronger evidence of behaviour change — manager observation data gives L&D something firmer than a satisfaction score to point to.
Better resource allocation — L&D effort goes toward the highest-impact gaps instead of being spread evenly across every programme.
More credible conversations with the business — evidence-backed claims about training’s effect land differently with stakeholders than activity counts do.
Learning Analytics vs Training Evaluation: What’s the Difference?
The two overlap, and people reasonably use the terms loosely in conversation — but they’re not the same discipline.
| Learning Analytics | Training Evaluation |
| Focuses on analysing learning-related data | Evaluates the effectiveness or value of a programme |
| Often continuous and ongoing | Often planned around a specific intervention |
| Identifies patterns across data | Determines whether objectives or outcomes were achieved |
| Supports day-to-day decisions | Supports judgement and structured improvement |
The table above is the practical version of the relationship described earlier: analytics is the ongoing lens, evaluation is the periodic verdict.
How to Turn a Metric Into an Insight
This is the single most useful habit in this entire guide, and it’s worth drilling with more than one example.
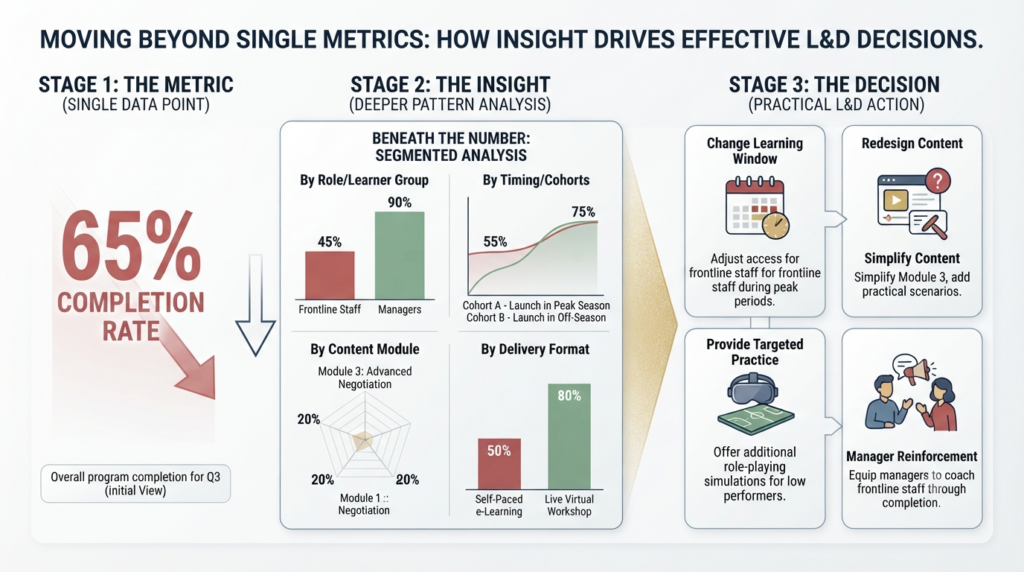
Case: completion rate
Metric: Completion fell from 94% to 82%.
Insight: The drop is concentrated among frontline employees whose modules were scheduled during peak operating hours.
Decision: Move the learning window and provide supervisor-supported access instead of assuming the content itself lost relevance.
Case: assessment score
Metric: Average assessment score is a healthy 88%.
Insight: Question-level data shows the average is propped up by easy recall questions; the one application-based question on the assessment has a 45% failure rate.
Decision: Don’t read the headline score as evidence the skill was learned — redesign the assessment to weight application more heavily, then re-test.
A single number rarely tells you what to do next. The insight sits one layer beneath it, in the breakdown by group, question, or time period.
How to Use Learning Analytics for Employee Training
A working process, stripped of theory:
Before you start: is your learning data trustworthy?
Analytics can be technically correct and still be practically wrong if the underlying data isn’t consistent. Before analysing anything, check:
- Is the definition of this metric consistent across teams and systems?
- Is the data complete, or are large chunks missing (e.g. manager observations logged for only a third of learners)?
- Is the time period being compared fairly (like-for-like, not a partial quarter against a full one)?
- Are different groups measured the same way?
- Is the metric actually measuring what we think it’s measuring?
Step 1 — Start with a business or performance question
“Why are new employees taking longer to reach productivity?” “Why are customer complaints increasing?” “Why are managers struggling with performance conversations?” “Why aren’t trained employees applying the skill on the job?” The original performance problem the programme was built to solve is the anchor for everything that follows — which is exactly what a training needs analysis should already have on record.
Step 2 — Define the desired outcome
Be specific about what success looks like before collecting a single data point. “Better performance” isn’t measurable. “Reduce order-entry errors by new hires in their first 60 days” is.
Step 3 — Identify the minimum useful data
Resist the instinct to pull every field the LMS can export. Ask what you’d need to answer Step 2’s question, and stop there.
Step 4 — Establish a baseline
If you don’t know the error rate before the training, you can’t credibly claim it improved afterward. A baseline is simply the pre-training measure of the same metric you’ll track post-training.
Step 5 — Analyse the pattern
Look for differences between groups, trends over time, gaps against the baseline, outliers worth investigating, and relationships between data sets. And be careful with one word in particular:
| A note on causation Correlation does not automatically prove that training caused the improvement. If sales rise after a training rollout, so did the new pricing structure, the new CRM, and the season. Analytics can build a credible case; it rarely produces airtight proof on its own. |
Step 6 — Turn insight into action
- Redesign specific content
- Adjust the assessment
- Add targeted practice
- Coach managers directly
- Target specific learner groups
- Change the delivery method
- Add reinforcement after the initial training
Step 7 — Re-measure
Close the loop. Question → Data → Analysis → Insight → Action → Re-measure. Skipping the re-measure step is how teams end up making the same “fix” twice without ever knowing if the first one worked.
The TrainerCentric 5Q Framework: A Signature Approach for Beginners
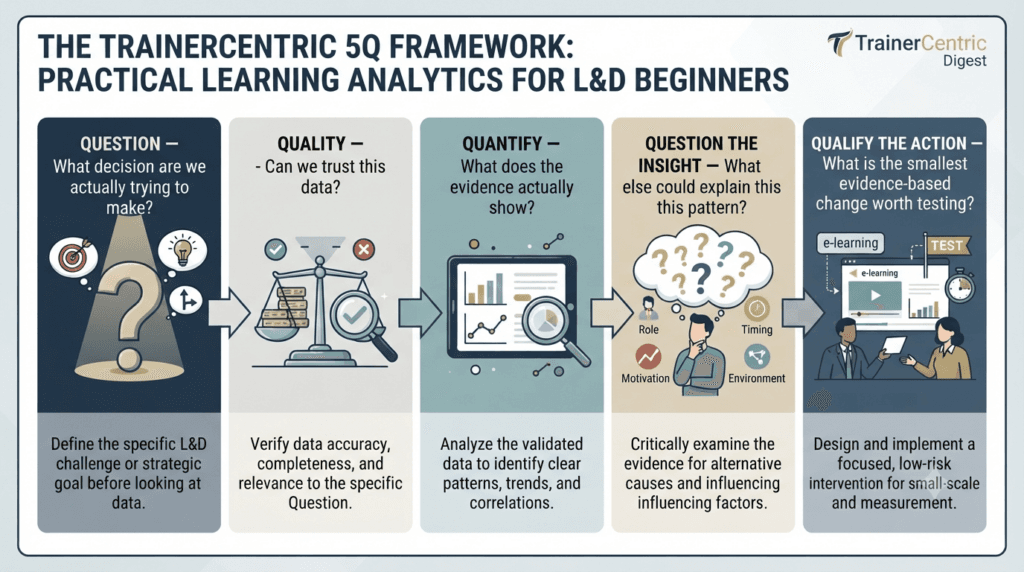
Most of what’s above compresses into five questions worth keeping on a sticky note. This is the closest thing this guide has to a proprietary takeaway — a sequence built specifically to feel usable under real time pressure, not academic.
| Step | What It Means |
| 1. Question | What decision are we actually trying to make? |
| 2. Quality | Can we trust this data? |
| 3. Quantify | What does the evidence actually show? |
| 4. Question the insight | What else could explain this pattern? |
| 5. Qualify the action | What is the smallest evidence-based change worth testing? |
That last step is deliberately narrow. “What should L&D do differently” invites a full redesign. “What is the smallest evidence-based change worth testing” invites an experiment — something you can act on this month and re-measure, rather than a six-month rebuild justified by one data point.
Applied to a real case: a customer service team’s average handle time hasn’t moved after a new-process training (Question). The LMS data is reliable, but manager coaching logs are patchy (Quality). Handle time is flat overall, but improved for the half of the team whose managers ran the follow-up coaching sessions (Quantify). Before concluding the training failed, consider that coaching consistency — not the training content — might be the real variable (Question the insight). The smallest useful test is to make the coaching step mandatory for one region and re-measure in eight weeks, rather than rebuilding the course (Qualify the action).
A Messier Example: When the Data Doesn’t Line Up Neatly
The examples so far resolve cleanly. Real learning analytics usually doesn’t, and it’s worth walking through a case where the evidence points in more than one direction.
A leadership programme reports an 18% improvement in post-training confidence scores. Managers who completed it also self-report having better conversations with their teams. Six months later, though, engagement survey scores for those same teams have barely moved.

A team new to analytics might read that as “the training didn’t work.” A more careful read looks like this:
- Confidence genuinely improved — the self-assessment data is consistent and the increase is real.
- Some behaviour change likely occurred — the qualitative manager feedback is plausible, though self-reported and worth treating cautiously on its own.
- Coaching follow-through varied significantly by region — roughly half of participating managers received no structured follow-up after the programme.
- Engagement scores are influenced by several other things happening at the same time: a reorganisation, a hiring freeze, and a separate pay-review cycle all landed in the same six months.
- The original hypothesis — that better manager conversations would move engagement — is only partially supported. Confidence moved. Behaviour moved somewhat. Engagement, which sits furthest from the training and closest to everything else happening in the business, didn’t move in a way that can be cleanly attributed to the programme.
The honest conclusion isn’t “success” or “failure.” It’s that the programme changed what it could plausibly change, the follow-through mechanism (manager coaching) was inconsistent, and engagement was never a fair single measure of this intervention’s success on its own. The useful action is fixing the coaching follow-through and choosing a closer, more attributable metric next time — not abandoning the programme or overselling it either.
Learning Analytics Examples for Corporate L&D
Example 1 — New-hire onboarding
Data: completion, assessment scores, time-to-productivity, manager observations.
Insight: one specific module correlates with repeated on-the-job errors.
Action: redesign that module and add hands-on practice.
Example 2 — Sales training
Data: assessment results, role-play scores, CRM performance, manager observations.
Insight: knowledge scores are strong, but application in real calls remains weak.
Action: increase live practice and structured manager coaching.
Example 3 — Compliance training
Data: completion, assessment, repeat attempts, post-training error rates.
Insight: completion is high, but errors stay concentrated around one or two specific topics.
Action: target reinforcement on those topics rather than assigning another full course.
Example 4 — Soft-skills programme
Data: self-assessment, manager observation, behavioural indicators, follow-up feedback.
Soft skills resist tidy measurement. A confidence self-rating and a manager’s observation of a difficult conversation are both legitimate data — but neither should be treated as a precise numerical score standing in for something as layered as communication or judgement. Triangulating a few imperfect signals beats trusting one clean-looking number.
Measuring Training Effectiveness With Learning Analytics
Analytics can support the chain from learning, to behaviour, to performance, to business outcome — but it rarely proves that chain with certainty on its own. What strengthens the case is attention to baseline, comparison groups, timing, organisational context, and manager input alongside the numbers. This is a real, well-documented gap in the profession: CIPD’s research on learning evaluation notes that most L&D evaluation stops at learner satisfaction, well short of confirming whether learning actually transferred into the workplace — precisely the gap this guide is trying to help close.
Learning analytics can provide the evidence that supports an ROI conversation, but it doesn’t automatically produce an ROI figure on its own — that translation from evidence to financial value is a distinct step, covered in the ROI and Phillips articles linked above.
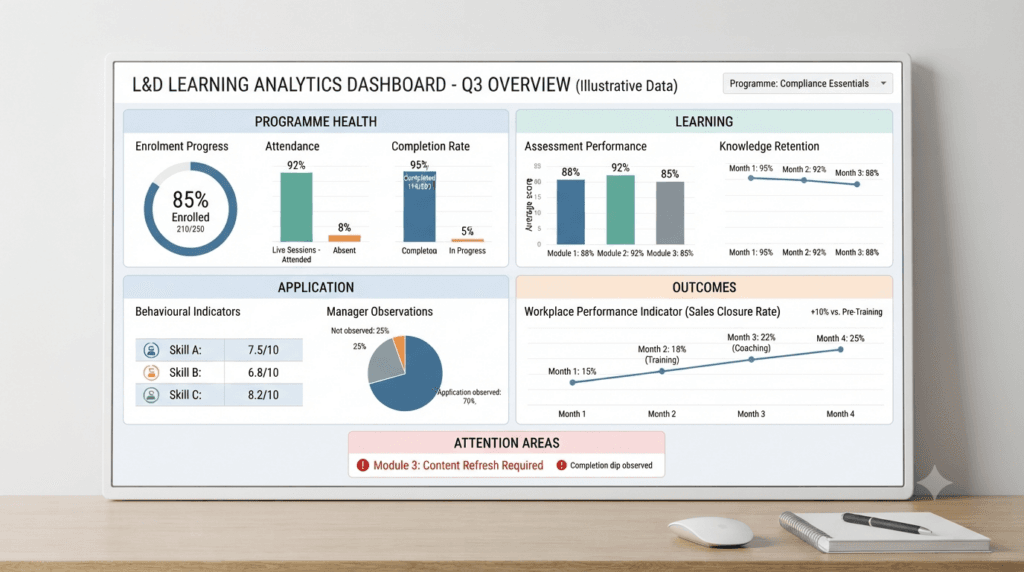
What Should a Beginner’s Learning Analytics Dashboard Include?
Keep it simple. A dashboard’s job is to answer questions, not to display everything the LMS can technically export.
- Programme health: enrolment, attendance, completion
- Learning: assessment performance, knowledge retention
- Application: behaviour indicators, manager observations
- Outcomes: one selected performance indicator tied to the original problem
- Attention areas: learners, groups or modules that need intervention
Where Is Your L&D Team on the Analytics Journey?
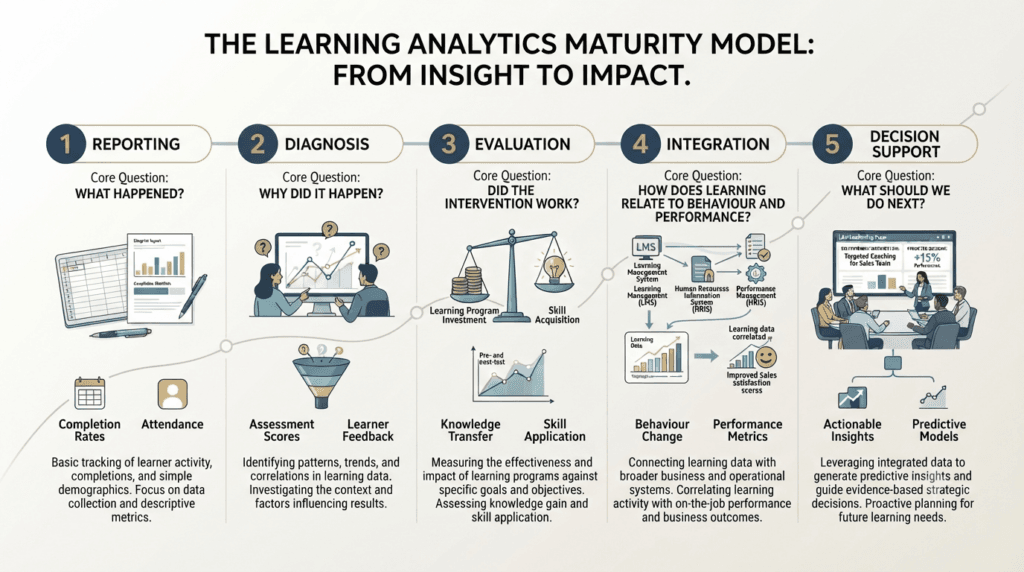
A simple maturity model, useful for an honest self-assessment rather than a scorecard to game:
| Level | Core Question |
| 1. Reporting | What happened? |
| 2. Diagnosis | Why did it happen? |
| 3. Evaluation | Did the intervention work? |
| 4. Integration | How does learning relate to behaviour and performance? |
| 5. Decision support | What should we do next? |
Many L&D teams will recognise themselves at Level 1, with some practices already reaching Level 2 — that’s a reasonable starting point, not a failure. The goal of the process in this article is to move deliberately toward Levels 3 and 4, not to leap to Level 5 before the earlier levels are solid.
L&D Analytics Tools for Small Businesses and Small L&D Teams
This isn’t a product review. What matters more than any specific brand is matching the tool to where your team actually is on the maturity model above — most teams don’t need to skip straight to Level 5.
| Level | Tool Category | What It’s For |
| 1 | Spreadsheet (Excel / Google Sheets) | Where almost every beginner should start — flexible enough for real analysis |
| 2 | LMS reporting | Participation and assessment data, usually already available |
| 3 | Survey platforms | Learner feedback and self-assessment data |
| 4 | HR / performance systems | Performance outcome data — often needs a data-sharing conversation with HR |
| 5 | BI dashboards | For teams that have outgrown spreadsheet analysis and need automated, recurring views |
A small team can realistically start with an LMS export, a spreadsheet, and a clearly defined question — Levels 1 and 2 are enough to do genuinely useful analytics. Expensive tooling doesn’t fix a vague question; it just makes the vague question look more impressive on screen.
How to Get Started With Learning Analytics in Corporate L&D
A realistic 30-day approach, one programme at a time:
| Week | Focus |
| Week 1 | Define the question — choose one learning programme and one performance question about it |
| Week 2 | Map the data — identify what’s already available |
| Week 3 | Analyse — look for patterns and gaps |
| Week 4 | Act — make one evidence-based improvement and decide how it will be re-measured |
Start small — an enterprise system built before L&D has practised asking useful questions just repeats the same problem at greater cost.
Common Learning Analytics Mistakes L&D Teams Make
- 1. Measuring what the LMS can capture instead of what the business cares about — the LMS exports what it exports; that’s a convenience, not a strategy for what to track.
- 2. Using the assessment as your learning metric when it doesn’t resemble the job — a multiple-choice quiz can be passed without the skill it’s meant to certify actually transferring.
- 3. Confusing completion with learning — finishing a course proves attendance, not comprehension.
- 4. Treating satisfaction scores as proof of effectiveness — learners can enjoy a session that changes nothing about their performance.
- 5. Ignoring baseline data — without a “before,” there’s no credible “after.”
- 6. Looking at averages only — an average can hide the fact that one group improved sharply while another got worse.
- 7. Asking managers for behavioural data six months later — recall fades fast; observation data collected long after the fact is often more guess than record.
- 8. Assuming correlation means causation — the most common analytics error in L&D.
- 9. Building dashboards before defining questions — produces a dashboard nobody quite knows how to use.
- 10. Using analytics to judge learners instead of improve learning — the purpose is to improve the programme, not to rank people.
Learning Analytics Challenges for L&D Teams
Worth being honest about, rather than pretending analytics is simple once you’ve read one guide:
- Poor or inconsistent data quality across systems
- Disconnected systems that don’t talk to each other
- Limited analytical skills within L&D
- Lack of baseline data
- Weak manager involvement in behaviour data
- Privacy concerns around learner data
- Difficulty linking learning to business outcomes with confidence
- Too much data and too little actual decision-making
None of this makes analytics inaccessible — it just means progress tends to be incremental rather than a single dashboard launch that solves everything at once.
Ethical Use of Learner Data
Learner data should be collected and used responsibly, guided by a few consistent principles:
- Purpose limitation — collect data for a stated reason, not just because it’s available
- Transparency — learners should know what’s being tracked and why
- Data minimisation — collect what’s needed, not everything possible
- Access — limit who can see individual-level learner data
- Security — protect the data you hold
- Appropriate interpretation — don’t over-read what a metric can actually tell you
- Avoiding unnecessary surveillance — the goal is improving learning, not monitoring people
For Indian organisations specifically, learner and employee data increasingly falls within the scope of the Digital Personal Data Protection Act, 2023. Its rules were notified in November 2025, with obligations phasing in through 2026 and full substantive enforcement expected from mid-2027 — worth checking against the current government timeline rather than treating any single date here as final. This is a large enough topic to deserve its own treatment — including what the Act specifically means for L&D data practices — covered in Ethical Use of Learner Data [internal link” Ethical Use of Learner Data: What L&D Must Know About GDPR and Privacy” ]. Treat the points above as principles, not legal advice.
What Should L&D Professionals Learn About Data Analytics?
If you work in L&D and data analytics for non-technical professionals feels intimidating, the reassurance is genuine: you don’t need to become a statistician, a data engineer, a programmer, or a data scientist. What’s actually useful is a much shorter list:
- Asking measurable questions
- Understanding basic metrics
- Reading tables and charts without freezing up
- Spotting trends
- Comparing groups carefully
- Interpreting averages with appropriate scepticism
- Questioning assumptions — including your own
- Turning evidence into decisions
Learning Analytics in Distributed and Multilingual Workforces
Learning analytics gets meaningfully harder once a workforce is spread across regions, languages, and delivery modes — a reality for many Indian L&D teams, among others managing large, distributed, multilingual workforces. Rather than treat this as a geography footnote, it’s worth naming the specific mechanics that break otherwise sound analytics:
- A completion metric defined one way by one regional team and another way by a second, quietly producing two incomparable numbers under the same label.
- Language versions of a course with different difficulty levels, so assessment scores aren’t strictly comparable across cohorts.
- Frontline and shift-based populations where manager observation is inconsistent simply because supervision ratios and shift patterns vary by site.
- Blended delivery — classroom plus digital — where only the digital portion generates trackable data, quietly under-representing part of the learning experience.
None of this changes the fundamentals covered earlier in this guide. It does mean data quality and consistent metric definitions deserve more deliberate attention than in a single-site, single-language organisation — the “Is your learning data trustworthy?” questions from earlier are worth applying region by region, not just programme by programme.
Frequently Asked Questions
What is learning analytics in L&D?
Learning analytics is the collection, analysis and interpretation of data about learners and learning activity to inform better decisions about training design, delivery and impact.
What metrics should L&D professionals track?
Track four categories: activity metrics (completion, attendance), learning metrics (assessment performance), behaviour metrics (manager observations, application), and business metrics (performance outcomes).
Do L&D professionals need data science skills to use learning analytics?
No. You need to ask measurable questions, read basic tables and trends, and interpret metrics carefully — not build statistical models or write code.
What is the difference between learning analytics and training evaluation?
Learning analytics looks for patterns in ongoing learning data to support decisions. Training evaluation judges whether a specific programme met its objectives. The two complement each other.
How can learning analytics improve employee training?
By showing where learners struggle, whether behaviour changed on the job, and which groups need more support — then feeding that back into content, coaching or reinforcement decisions.
How can a small L&D team get started with learning analytics?
Pick one programme, define one performance question, use an LMS export and a spreadsheet, establish a baseline, and re-measure after acting on what the data shows.
Final Takeaway
Learning analytics for L&D professionals isn’t about becoming obsessed with dashboards, and it isn’t a technology problem waiting on the right software purchase. It’s about getting better at asking questions, reading evidence honestly — including when that evidence is messy and doesn’t resolve neatly — and making decisions on the strength of it.
The strongest L&D professionals aren’t the ones who collect the most data. They’re the ones who can answer one question clearly: what are we trying to improve, what evidence do we actually have, and what should we do next?
A practical first step: pick one existing training programme. Ask one meaningful performance question about it. Identify three useful data points. Establish a baseline. Analyse what changed. Then decide what L&D should do differently — and re-measure.
Good learning analytics doesn’t begin with a dashboard. It begins with a good question.
References
- Society for Learning Analytics Research (SoLAR)
- Learning Evaluation, Impact and Transfer — CIPD
- Evidence-Based Practice for Effective Decision-Making — CIPD
- Educational Data Mining and Learning Analytics: An Updated Survey
- Digital Personal Data Protection Act, 2023 — India Code
Further Readings
- Kirkpatrick Model: How to Measure Training Effectiveness
- How to Calculate Training ROI Step-by-Step
- Phillips ROI Model Explained: With Examples and 1 Free ROI Calculator
- Ultimate Guide to Training Needs Analysis
- Job Task Analysis
- How to Present TNA Results to Senior Stakeholders
- The 3 Levels of Training Needs Analysis: Organisation, Task & Person Analysis
- Learning Objectives Guide
- Training Needs Analysis Template
Author Details

Soumyadeep Sen is a Learning & Development professional with over 14 years of experience across training, coaching, quality, and performance improvement. Currently serving as Assistant Manager – Training at 24/7.ai, he specializes in designing practical learning solutions that drive employee performance and support business objectives. When he’s not designing learning programs, Soumyadeep enjoys exploring emerging trends in workplace learning, talent development, and instructional design. Reach out to him via Linkedin.