Conducting a Training Needs Analysis (TNA) is only half the job. The harder, and often more consequential, half is turning raw findings into a report that decision-makers can act on. A well-built TNA can identify every performance gap in an organization, but if the findings never make it into a document that a CFO, VP of Operations, or department head can quickly understand, the analysis rarely translates into funded action.
In practice, this is where most people land on this page. If you searched for examples of TNA reports, you are probably not looking for another explanation of what a TNA is — you want to see what a finished report actually looks like: the pages, the tables, the phrasing, the structure a stakeholder would actually receive. That is what this article focuses on.
If you need the underlying methodology first, our article on What is Training Needs Analysis? covers that in depth. This piece assumes that foundation and goes straight to report artifacts: sample pages, four full report examples presented in different formats, a reusable outline, a side-by-side of a weak report versus a strong one, and the mistakes that most often keep a solid analysis from being acted on.
What a Complete TNA Report Includes
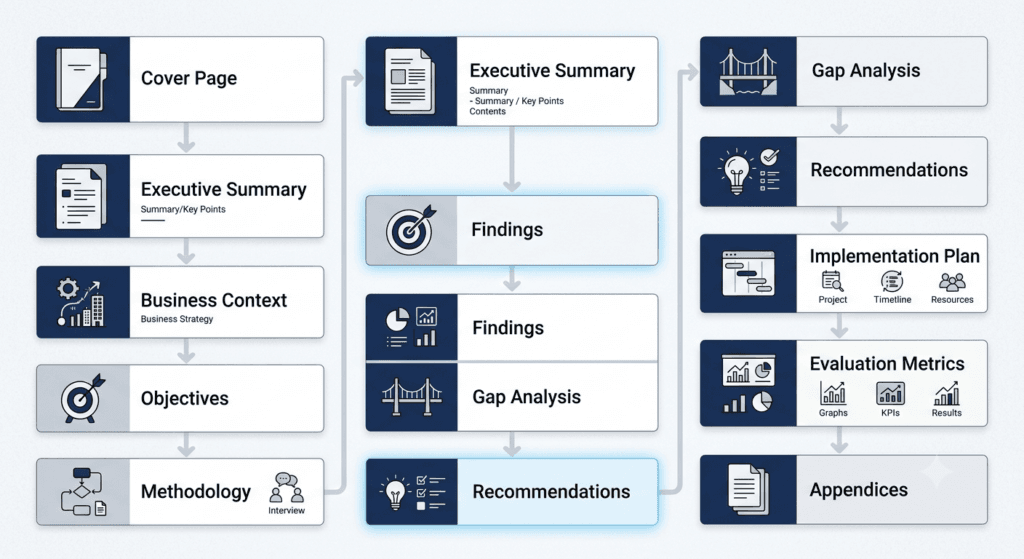
Organizations differ in formatting preferences, but the core architecture of a professional TNA report is consistent across industries, largely because it mirrors standard consulting and business-case documentation. A complete report typically includes an executive summary, business context, objectives, methodology, stakeholder list, data collection methods, key findings, performance gaps, root cause analysis, training recommendations, non-training recommendations, implementation priorities, success measures, and appendices.
A few of these components deserve a quick note before moving into the examples. The findings section should present data without interpretation — save the analysis for the gap section.
The gap analysis stage is where the report earns its value, and it is also where the results most often connect back to a formal Skills Gap Analysis or Competency Mapping exercise conducted earlier in the process; if those steps were skipped or rushed, the gap analysis in the report tends to be shallow. And the split between training and non-training recommendations is one of the clearest markers of a mature report — a distinction emphasized in Robert O. Brinkerhoff’s work on evaluating training’s real contribution to performance, and echoed in ATD and CIPD guidance on needs documentation.
| Trainercentric Tip: If your findings section reads like a survey summary and your recommendations section reads like a course catalog, the report is missing its most important element — the analytical bridge between the two. That bridge is the gap and root cause analysis, and it’s usually where reports either earn stakeholder trust or lose it. |
Sample Report Preview: What the Actual Pages Look Like
Before the full examples, here is a condensed preview of what several key pages of a finished TNA report look like in practice. This is intentionally shortened — a real report runs 15–30 pages — but the layout below reflects the actual structure and level of detail used in client-facing documentation.
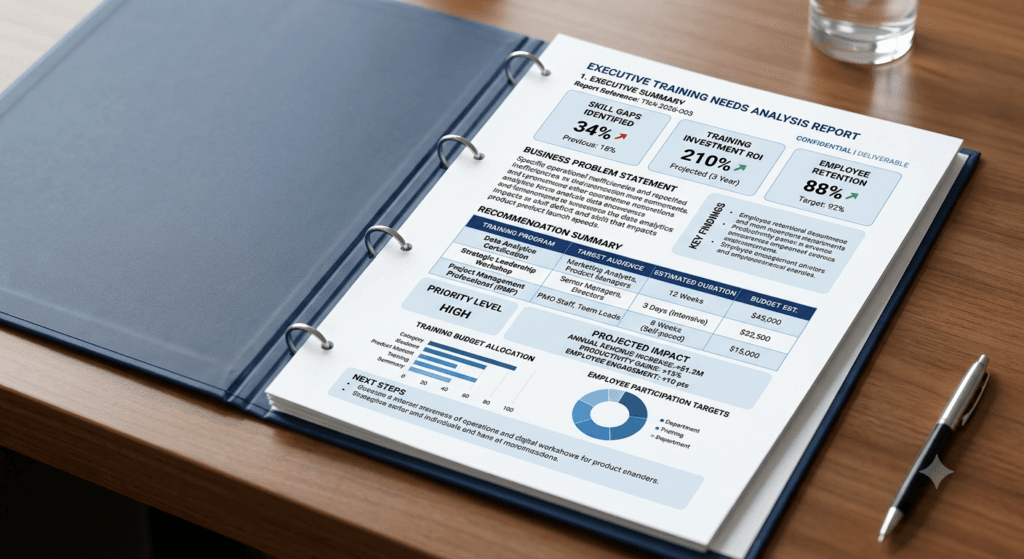
Cover Page (example layout)
| TRAINING NEEDS ANALYSIS REPORT Sales Performance & Discovery Skills Assessment Prepared for: [Client / Department Name] Prepared by: [L&D Team / Consultant Name] Date: [Report Date] Confidential — For Internal Use Only |
Executive Summary Page (example)
| Field | Content |
| Business Problem | Sales conversion from discovery call to proposal is 17 points below benchmark |
| Analysis Scope | 45 sales reps, 3 regions, 2 quarters of CRM data |
| Primary Finding | Gap is concentrated in discovery questioning, not product knowledge |
| Recommendation | Structured discovery-call training + revised call framework |
| Investment Required | [Budget range] |
| Projected Impact | 10–12 point conversion improvement within two quarters |
| Priority Level | High |
Gap Analysis Page (example)
| Performance Area | Current State | Required State | Gap | Root Cause |
| Discovery call conversion | 38% | 55% | 17 points | Skill gap in needs-based questioning |
| New hire ramp time | 5 months | 3 months | 2 months | Onboarding omits discovery coaching |
Interview Summary Excerpt (example)
| Stakeholder: Regional Sales Director Key Theme: Reps default to product pitching within the first five minutes of a call, before uncovering the customer’s actual pain points. This pattern is consistent across all three regions and is not tied to tenure. |
Appendix Reference Page (example)
Appendices typically list the raw instruments behind the findings: survey questionnaire, interview guide, call scoring rubric, and any data extracts referenced in the body of the report. Naming these explicitly — rather than folding them into a generic “supporting data” appendix — makes the report easier for a stakeholder to audit later.
The examples above are simplified for readability. The downloadable toolkit referenced later in this article contains complete, editable versions of these same pages, formatted for client presentations and executive review.
With the anatomy of the pages established, here are four full report examples, each presented in a different format to reflect how these reports actually vary in practice.
Example 1 – Sales Training Needs Analysis Report (Presented as Report Excerpt)
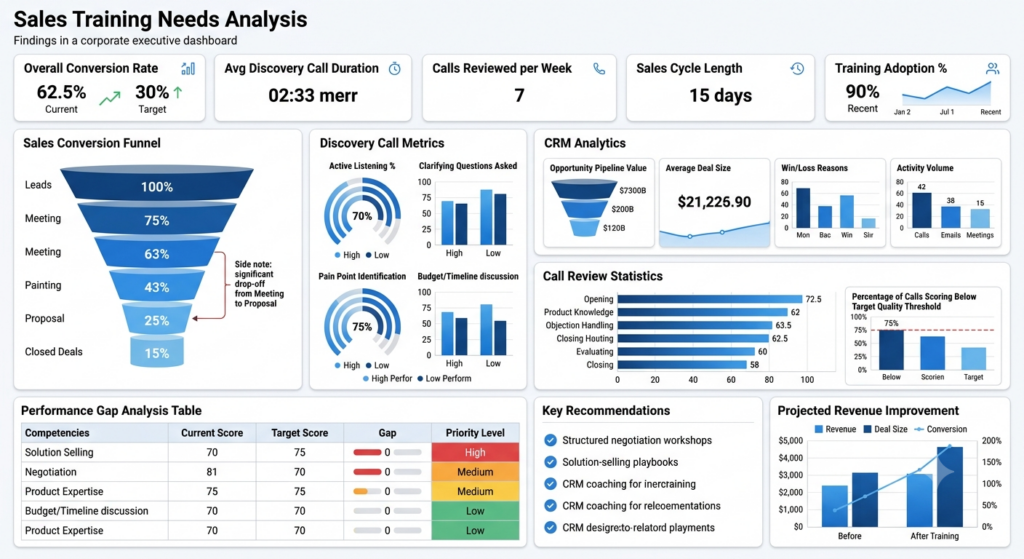
Background: A mid-sized B2B software company with a 45-person sales organization was missing quarterly revenue targets despite strong lead volume from marketing.
Methodology: CRM win/loss data, 30 recorded discovery calls, manager shadowing sessions, and a 20-question rep survey — a mixed-methods approach consistent with ATD guidance on triangulating findings across multiple sources rather than relying on one.
| Unexpected Finding: Leadership’s initial hypothesis was that reps lacked product knowledge, and had already requested a refresher course on product features. Call reviews told a different story: reps knew the product well. The real problem was that they were pitching it before understanding the customer’s situation. |
What follows reads as it would appear directly in the delivered report:
| Executive Summary Sales representatives are converting discovery calls to proposals at 38%, against a company benchmark of 55%. Analysis of 30 recorded calls and manager interviews indicates the primary gap is in needs-based discovery questioning, not product knowledge. Recommended interventions include a structured discovery-call training program and revised call scripting, with an estimated payback period of under two quarters if conversion rates return to benchmark. Key Finding 3.2 — Call Structure Seventy-two percent of reviewed calls moved into product pitching within the first five minutes, before the rep had established the customer’s underlying business pain point. This pattern held consistently across tenure levels, indicating a structural gap in the sales process rather than an individual performance issue. Recommendation 5.1 Implement a three-week discovery-call training program combining live coaching, call review sessions, and a standardized questioning framework. Pair this with refreshed onboarding content so new hires receive discovery-skills coaching from day one, rather than product training alone. |
Performance gaps and root causes:
| Performance Gap | Root Cause | Training or Non-training? |
| Low discovery-to-proposal conversion | Lack of structured questioning framework | Training |
| Inconsistent objection handling | No standardized playbook | Training + non-training (documentation) |
| Slow ramp time for new hires | Onboarding skips discovery skills entirely | Training |
| Inaccurate CRM forecasting | No enforced data entry standard | Non-training (process/policy) |
Timeline: Design and pilot over six weeks; full rollout across the sales team by the end of the following quarter.
Expected business impact: A projected 10–12 percentage point improvement in discovery-to-proposal conversion within two quarters, based on results observed in the pilot cohort.
A pattern worth flagging here, seen repeatedly in sales TNA work: teams almost always have the CRM data to identify that conversion is down, but rarely have the call-level data to explain why. The call review step is usually what separates a report stakeholders act on from one that gets filed away.
Example 2 – Customer Service Training Needs Analysis Report (Presented as Mock Report Layout)
Background: A regional retail bank with a 60-agent contact center faced rising customer complaints and a customer satisfaction (CSAT) decline from 84% to 76% over two consecutive quarters.
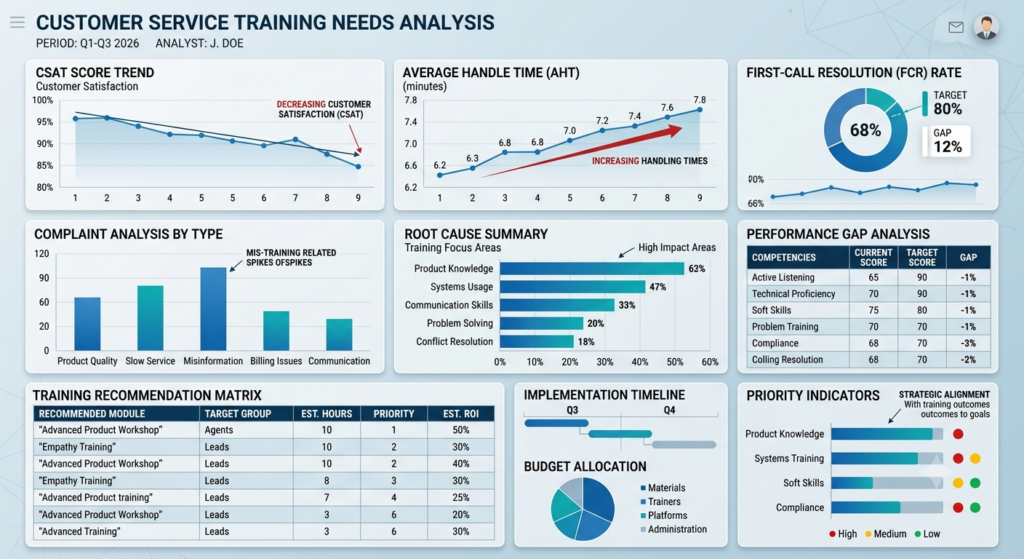
Rather than narrative prose, this report leaned heavily on a dashboard-style layout, since the client’s leadership team preferred to review findings in a single scannable page before reading the full document.
Section 1 — Performance Snapshot
| Metric | Prior Quarter | Current Quarter | Target | Status |
| CSAT | 84% | 76% | 85% | Below target |
| First-call resolution | 71% | 59% | 75% | Below target |
| Average handle time | 6.4 min | 9.2 min | 6.0 min | Above target |
| Agent confidence (self-rated, policy knowledge) | — | 2.9 / 5 | 4.0 / 5 | Below target |
| Complaint volume (policy-related) | Baseline | +30% | — | Increasing |
Section 2 — Contributing Factors (from manager interviews)
| Unexpected Finding: Leadership’s working theory was that agents needed a refresher on soft skills and de-escalation, given the rise in complaints. The complaint data pointed somewhere else entirely: customers weren’t describing agents as rude — they were describing them as unsure. The root cause was a knowledge gap, not an attitude problem. |
Managers consistently pointed to a policy change introduced six months earlier via a single email announcement, with no structured training, as the likely turning point. This is a common finding in service environments and is a reason documentation review — not just call audits — belongs in the methodology for any customer service TNA.
Section 3 — Call Quality Audit Findings
Agents frequently placed customers on hold to consult internal documentation, extending handle time. First-call resolution dropped specifically for calls involving the updated policy, not across all call types, and escalation rates to supervisors doubled for policy-related inquiries.
Section 4 — Customer Complaint Themes
Complaint text analysis showed dissatisfaction centered on perceived agent uncertainty rather than rudeness or unresponsiveness — confirming the reframed root cause above and ruling out a broader customer-service skills overhaul.
Section 5 — Recommended Interventions
| Recommendation | Type | Priority | Why |
| Structured refresher training on updated policy, with scenario-based practice | Training | High | Directly addresses the confirmed root cause |
| Quick-reference job aid for common policy scenarios | Non-training | High | Fast to deploy; reduces hold time immediately |
| Coaching for supervisors on real-time call support | Training | Medium | Improves escalation handling but doesn’t fix the underlying knowledge gap |
| Formal policy rollout procedure requiring training sign-off before launch | Non-training (process) | Medium | Prevents recurrence, but doesn’t resolve the current gap |
Expected business impact: Restoring CSAT to the prior 84% baseline within one quarter, based on the direct correlation identified between the policy-related knowledge gap and the decline in first-call resolution.
Example 3 – Leadership Development Needs Analysis Report (Presented as Executive Dashboard)
Background: A manufacturing company with 1,200 employees identified a succession planning gap after two senior director departures within six months, neither with an internal successor ready to step in.
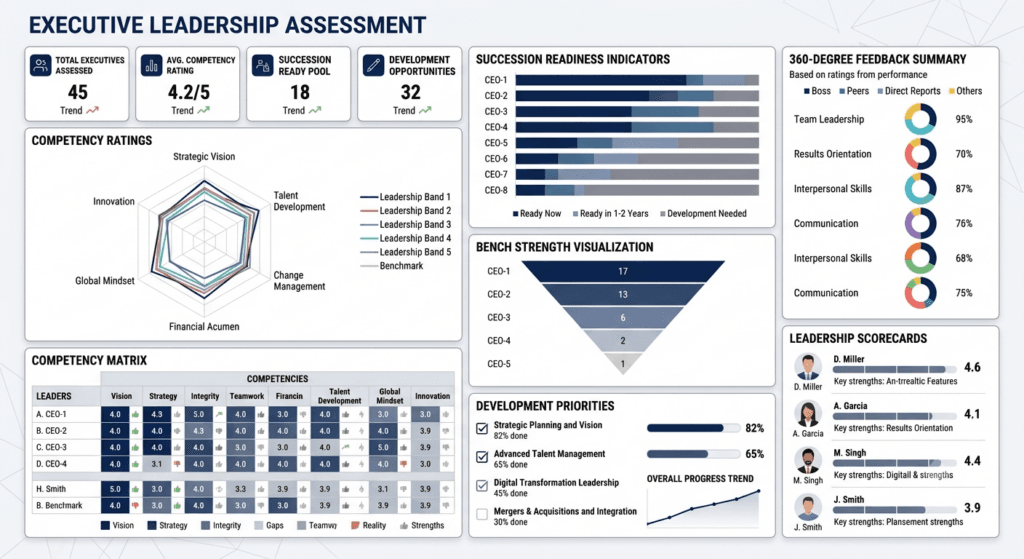
This report was built primarily around a single scorecard page, since the audience — the executive committee — had limited time and wanted the bench-strength picture at a glance before discussing next steps. The underlying ratings were drawn from a Competency Mapping exercise run alongside the 360 process, which made it possible to compare each manager against a defined leadership competency model rather than a generic scale.
Leadership Bench Strength Scorecard
| Competency Area | Avg. 360 Rating (/5) | Bench Readiness | Priority |
| Strategic thinking | 2.8 | Low | High |
| Financial acumen | 2.4 | Low | High |
| Delegation | 3.1 | Moderate | Medium |
| Cross-functional influence | 2.6 | Low | High |
| Unexpected Finding: HR’s original theory was that these managers simply weren’t ready for promotion. The 360 data suggested otherwise: capability was rarely the issue. Every manager rated lowest on strategic thinking and financial acumen had spent their entire tenure inside a single function — the gap was exposure, not readiness. |
Senior leaders consistently described high-potential managers as excellent individual performers who had never been given stretch assignments or cross-functional exposure. In one leadership assessment of this kind, the same theme surfaces almost every time: the gap isn’t capability, it’s exposure.
Development priorities
| Priority | Recommended Intervention | Format |
| 1 | Financial acumen for non-financial managers | Cohort-based training |
| 2 | Cross-functional rotational assignments | Non-training (structural) |
| 3 | Executive coaching for top 10 high-potential managers | Coaching program |
| 4 | Formal succession planning framework | Non-training (process) |
Expected business impact: A defined successor identified for each senior role within 18 months, reducing dependency on external hiring for critical leadership positions.
Unlike the previous example, this analysis relies more heavily on qualitative inputs — 360 feedback and interviews — than on hard performance metrics. That’s consistent with Allison Rossett’s work on needs assessment, which emphasizes matching data collection methods to the nature of the performance question being asked, rather than forcing every analysis into the same data format.
Example 4 – Manufacturing Safety Training Needs Analysis (Presented as Findings Matrix)
Background: A manufacturing plant with 300 production employees experienced a 22% increase in reportable safety incidents over the previous year, drawing regulatory attention.
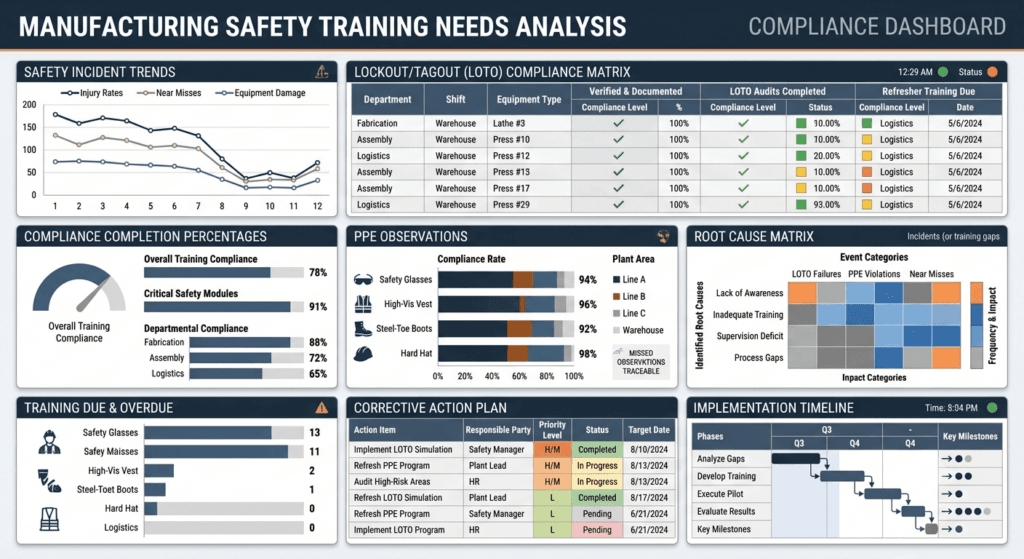
Given the compliance stakes, this report was built almost entirely around matrices rather than narrative sections, since the audit trail mattered as much as the interpretation.
Compliance Findings Matrix
| Area | Requirement | Actual | Gap |
| Annual safety refresher | 100% completion | 68% completion | 32-point gap |
| Lockout/tagout procedure | 100% compliance | 61% observed compliance | 39-point gap |
| Hearing protection in designated zones | 100% usage | Inconsistent | Gap confirmed by observation |
Incident Root Cause Matrix
| Incident Category | Count (12 mo.) | Linked to Training Gap? | Root Cause |
| Procedural non-compliance | 19 | Yes (14 of 19) | Refresher not completed |
| Equipment failure | 8 | No | Maintenance-related |
| Other | 7 | Partial | Mixed factors |
| Unexpected Finding: The initial theory was that newer, less experienced employees were driving the rise in incidents. Floor observations showed the opposite: tenured employees were more likely to bypass lockout/tagout steps, and informal shortcuts had been passed down to newer hires as unofficial “normal practice.” |
A pattern consultants encounter often in safety audits like this one: the shortcuts weren’t a knowledge deficit — tenured staff knew the correct procedure. They were a behavioral pattern reinforced by production time pressure.
Recommended Interventions
| Recommendation | Type |
| Mandatory refresher training with completion tracked against production scheduling | Training |
| Toolbox talks reinforcing lockout/tagout procedure at shift start | Training |
| Supervisor accountability protocol for procedural enforcement | Non-training (process) |
| Revised scheduling to prevent training-production conflicts | Non-training (operational) |
Safety-related TNA reports typically need to satisfy both organizational and regulatory audiences, aligning findings against documented standards such as those referenced in ISO 10015 guidance on competence management, in addition to internal performance goals.
| Common Mistake: Treating a compliance completion rate as the finding, rather than investigating why completion was incomplete and what happened during the actual incidents. Compliance data alone rarely explains root cause — and regulators tend to ask the follow-up question anyway.. |
Bad Report vs. Good Report: A Side-by-Side
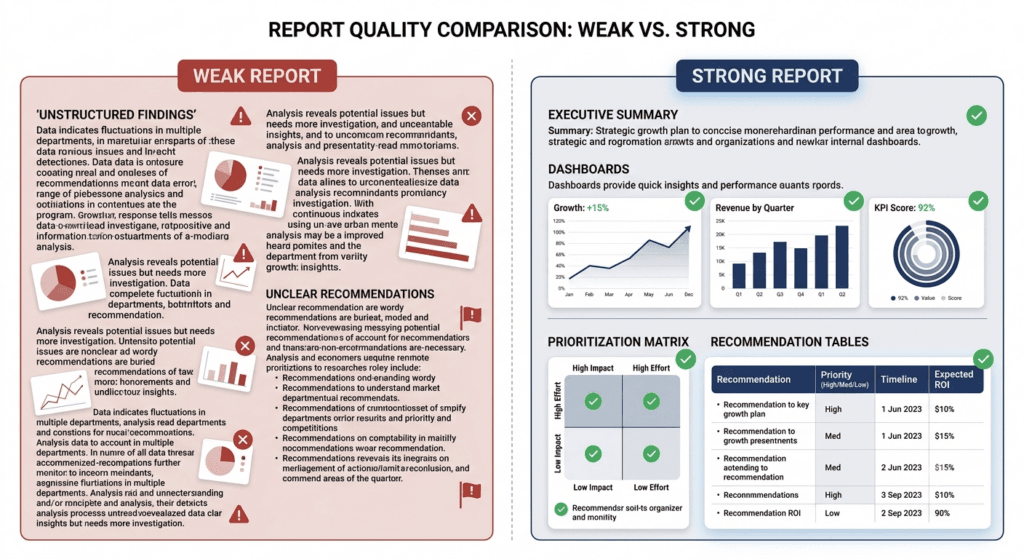
The difference between a TNA report that gets funded and one that gets filed away usually isn’t the quality of the underlying analysis — it’s the quality of the write-up. Here is what separates the two.
| Element | Weak Report | Strong Report |
| Length and structure | 28-page survey dump, no clear sections | Concise, structured, scannable in under five minutes |
| Opening | Starts with methodology | Starts with a one-page executive summary and the business problem |
| Findings | Raw data with no interpretation | Findings tied directly to business metrics |
| Recommendations | Generic (“provide more training”) | Specific, prioritized, and evidence-linked |
| Training vs. non-training | Not distinguished | Clearly separated |
| Prioritization | None — every finding treated equally | Ranked by urgency and business impact |
| Cost and timeline | Absent | Included, even as a range |
| Evaluation plan | Absent | Defined success measures tied to a framework like Kirkpatrick |
| Visual presentation | Wall of text | Tables, matrices, and a scorecard-style summary |
A useful gut check: if you handed the report to someone who was not in the room during the analysis, could they understand the problem, the evidence, and the recommended action in under five minutes? If not, the report needs restructuring before it needs more data.
Reusable Report Format and Supporting Matrices
The four examples above share a common underlying structure, adapted with different presentation styles. The outline below can serve as a starting template for most TNA reporting contexts, along with the matrices most reports end up needing regardless of industry.
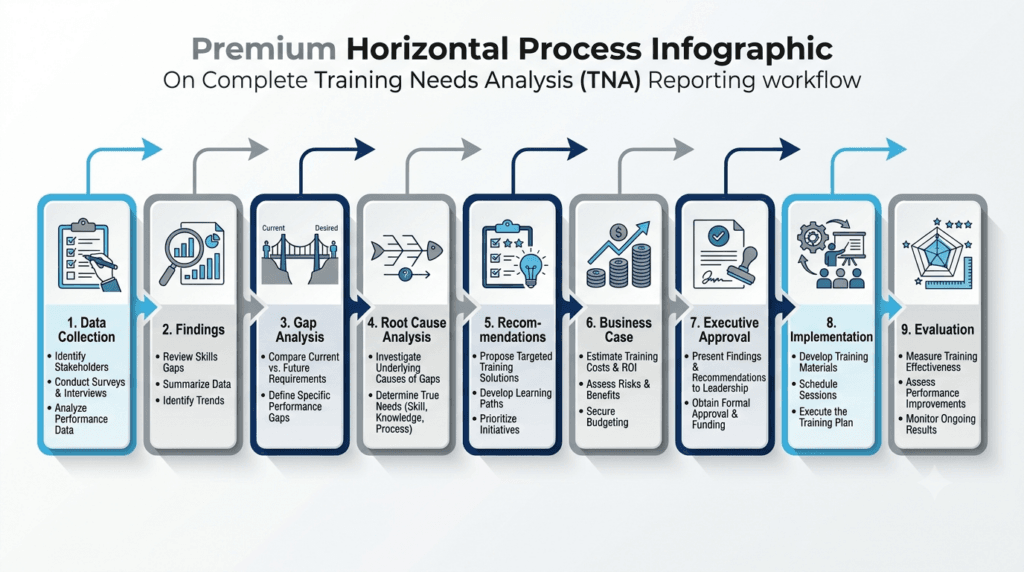
Standard Report Outline
Cover Page → Executive Summary → Business Problem → Methodology → Findings → Gap Analysis → Recommendations → Implementation Plan → Evaluation Metrics → Appendices.
The implementation plan section is usually where ADDIE becomes relevant in the report itself — the Design, Development, Implementation, and Evaluation phases give stakeholders a familiar model for how the recommended training will actually get built and rolled out, not just what it will cover.
The evaluation metrics section should reference a recognized Training Evaluation framework rather than inventing success measures from scratch — this is where the Kirkpatrick Model most often gets cited in executive-facing reports.
Priority Matrix (example)
| Recommendation | Business Impact | Effort to Implement | Priority | Why |
| Discovery-call training (Sales example) | High | Medium | 1 | Directly tied to revenue conversion |
| Policy refresher training (CS example) | High | Low | 1 | High impact, fast to deploy |
| Cross-functional rotations (Leadership example) | Medium | High | 2 | Long-term payoff, but slower to implement |
| Safety toolbox talks (Manufacturing example) | High | Low | 1 | Directly reduces incident risk |
Training vs. Non-Training Matrix (example)
| Finding | Training Fix? | Non-Training Fix? |
| Skill or knowledge gap | Yes | No |
| Process or policy gap | No | Yes |
| Motivation or incentive gap | Sometimes | Usually |
| Environmental or resourcing gap | No | Yes |
Stakeholder Analysis Table (example)
| Stakeholder | Interest | Influence | Engagement Approach |
| VP Sales | Revenue outcomes | High | Executive summary + ROI framing |
| Frontline Managers | Day-to-day execution | Medium | Detailed findings + coaching guide |
| HR Business Partner | Policy alignment | Medium | Non-training recommendations |
RACI Snapshot for Implementation (example)
| Task | Responsible | Accountable | Consulted | Informed |
| Design training program | L&D Lead | L&D Director | Subject Matter Experts | HRBP |
| Approve budget | Finance Partner | VP Sponsor | L&D Director | Executive Team |
| Track evaluation metrics | L&D Analyst | L&D Director | — | Executive Team |
Timeline Table (example)
| Phase | Weeks 1–2 | Weeks 3–6 | Weeks 7–12 |
| Design | Framework built | Pilot delivered | — |
| Rollout | — | — | Full deployment |
| Evaluation | — | Baseline set | First measurement checkpoint |
This structure holds up well in practice because it separates fact from interpretation and interpretation from recommendation — a sequencing principle that shows up consistently in both needs-assessment literature and applied consulting practice.
Common Mistakes in Training Needs Analysis Reports
Even well-conducted analyses can produce weak reports, and the same handful of mistakes show up across industries.
- Only reporting survey results. Surveys capture perception, not necessarily performance. A report built entirely on self-reported data lacks the triangulation that gives findings credibility with skeptical stakeholders — this is exactly why Person Analysis and observational data matter alongside survey instruments.
- Jumping directly to training. Recommending a training solution before completing root cause analysis risks proposing a fix for a problem training cannot solve — a process gap, an incentive gap, or a resourcing constraint.
- Ignoring business goals. A report that documents skill gaps without connecting them to revenue, quality, safety, or retention outcomes gives decision-makers no basis for prioritizing investment.
- Weak recommendations. Vague suggestions such as “provide more training” or “improve communication” are not actionable and signal an incomplete analysis. It’s a mistake seen constantly in first-draft reports from newer L&D professionals — the analysis is often solid, but the recommendation section reverts to generic language under deadline pressure.
- No prioritization. Presenting ten equally weighted recommendations forces stakeholders to do the prioritization work themselves, which reduces the report’s perceived value.
- No supporting evidence. Recommendations presented without linking back to specific findings appear speculative rather than analytical.
- No implementation plan. A report that stops at recommendations, without addressing timeline, ownership, and sequencing, is significantly less likely to be acted upon.
- No evaluation strategy. Without defined success measures — ideally tied to a recognized framework such as the Kirkpatrick Model or Jack Phillips’ ROI methodology — organizations have no way to determine whether the training investment paid off, which undermines the credibility of the next TNA report.
Best Practices for Writing Executive-Friendly Reports
Write for business leaders, not trainers. Executive readers are evaluating a business case, not a curriculum, so lead with business impact rather than learning objectives.
Use visuals strategically. Tables, scorecards, and gap-summary matrices communicate faster than narrative paragraphs, particularly for readers who will skim before deciding whether to read in full — the dashboard-style layout used in Example 2 is a useful model for time-constrained executive audiences.
Prioritize findings rather than listing them in the order data was collected, and quantify gaps wherever possible; “conversion is 17 points below benchmark” is more persuasive than “conversion needs improvement.”
Separate observations from recommendations so readers can evaluate the analysis independently of the proposed solution, and support every recommendation with a specific finding or data point referenced earlier in the report.
Keep language concise and actionable, and reference the evaluation frameworks readers already trust — the Kirkpatrick Model and Training Evaluation methodology in general give executive audiences a familiar way to judge whether your proposed success measures are credible.
Building These Reports Efficiently: The TrainerCentric Toolkit
The examples above show what a strong TNA report looks like once finished. Getting there — structuring interview guides, designing survey instruments, building gap analysis matrices, and formatting a document that looks executive-ready — takes real time, particularly for L&D professionals managing several projects at once.
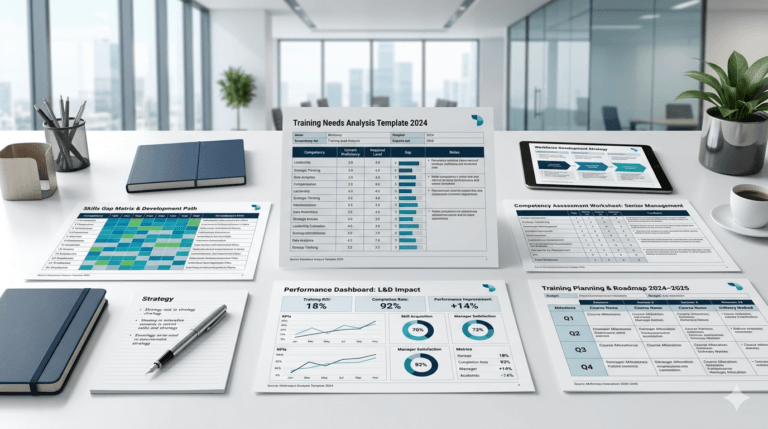
The TrainerCentric Strategic Training Needs Analysis Toolkit was built for that gap. It includes executive-ready report templates modeled on the structure and pages shown in this article, training needs analysis worksheets, stakeholder interview guides, survey templates, gap analysis frameworks, prioritization matrices, recommendation templates that separate training from non-training interventions, and presentation-ready reporting formats.
The examples in this article are intentionally condensed to highlight the structure and decision-making process. The toolkit includes the complete editable report templates — including executive summaries, findings matrices, stakeholder interview summaries, recommendation tables, and presentation-ready formats — suitable for client presentations and executive review without rebuilding the structure from scratch.
Conclusion
Organizations rarely approve training because someone identified a skills gap. They approve it because someone presented a compelling business case backed by evidence. A well-written Training Needs Analysis report is what turns observations into decisions — and the four examples in this article, spanning sales, customer service, leadership development, and manufacturing safety, show how the same underlying structure adapts to different data, audiences, and presentation formats.
When adapting these examples to your own organization, resist the temptation to simply document what was observed. Focus on connecting findings to business outcomes, distinguishing training from non-training interventions, and building a clear, evidence-based case for the recommendations you present.
Frequently Asked Questions
What is included in a Training Needs Analysis report?
A professional Training Needs Analysis report typically includes an executive summary, business context, objectives, methodology, findings, performance gaps, root cause analysis, training and non-training recommendations, implementation priorities, evaluation metrics, and supporting appendices. The exact structure may vary by organization, but these components provide decision-makers with the information needed to approve and prioritize learning initiatives.
How long should a Training Needs Analysis report be?
Most corporate TNA reports range from 15 to 30 pages, depending on the scope of the project, the number of stakeholders involved, and the volume of supporting data. Executive summaries are usually limited to one or two pages, while detailed findings and appendices make up the remainder of the report.
Who should prepare a Training Needs Analysis report?
Training Needs Analysis reports are commonly prepared by Learning and Development professionals, instructional designers, HR business partners, performance consultants, or external training consultants. Subject matter experts and department managers often contribute data and validate findings during the process.
What is the difference between a Training Needs Analysis report and a Training Needs Assessment?
A Training Needs Assessment is the process of collecting and analyzing information to identify performance gaps, while a Training Needs Analysis report is the document that summarizes the findings, conclusions, and recommendations. The report communicates the results of the assessment to stakeholders and decision-makers.
Should a Training Needs Analysis report include non-training recommendations?
Yes. A well-written TNA report should distinguish between issues that can be solved through training and those that require process improvements, technology changes, policy updates, coaching, or management interventions. Including non-training recommendations demonstrates a more comprehensive and evidence-based analysis.
References
- Training Needs Assessment || Allison Rossett || 1st Edition || Educational Technology Publications
- Analyzing Performance Problems || Robert F. Mager & Peter Pipe || 3rd Edition || Center for Effective Performance
- Telling Ain’t Training || Harold D. Stolovitch & Erica J. Keeps || 2nd Edition || Association for Talent Development (ATD) Press
- The Performance Consultant’s Fieldbook || Judith Hale || 2nd Edition || Pfeiffer
Further Readings
- Ultimate Guide to Training Needs Analysis
- How to Conduct a Training Needs Analysis
- Skills Gap Analysis vs Training Needs Analysis
- Job Task Analysis
- How to Present TNA Results to Senior Stakeholders
- The 3 Levels of Training Needs Analysis: Organisation, Task & Person Analysis
- ADDIE Model Explained
- Learning Objectives Guide
- Training Needs Analysis Template
- Focus Groups and Interviews
- Kirkpatrick Model: How to Measure Training Effectiveness
- 12 Facilitation Skills for Corporate Trainers: The Complete Guide
- Training Needs Analysis Questionnaire: Complete Guide (75 Questions & Free Template)
Author Details

Soumyadeep Sen is a Learning & Development professional with over 14 years of experience across training, coaching, quality, and performance improvement. Currently serving as Assistant Manager – Training at 24/7.ai, he specializes in designing practical learning solutions that drive employee performance and support business objectives. When he’s not designing learning programs, Soumyadeep enjoys exploring emerging trends in workplace learning, talent development, and instructional design. Reach out to him via Linkedin: https://www.linkedin.com/in/soumyadeep-sen-37515046/