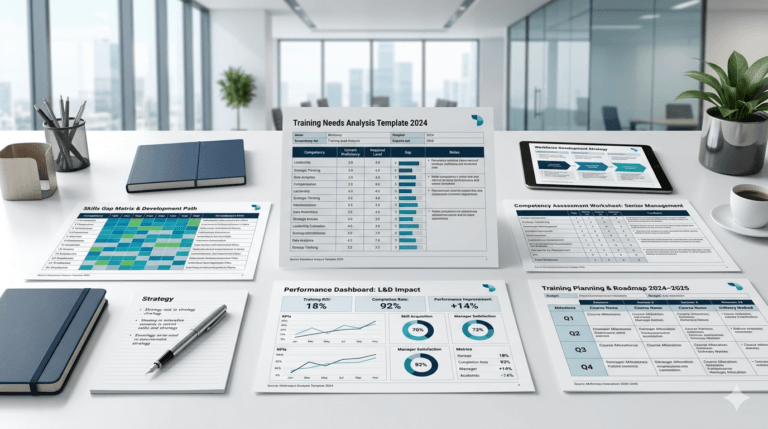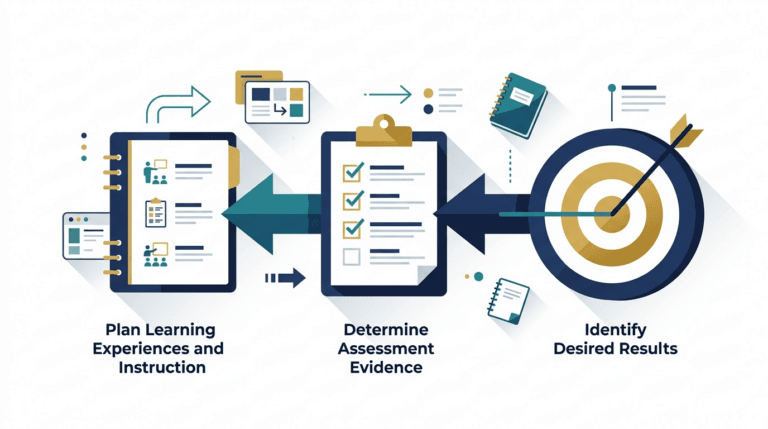
Knowing how to present training needs analysis results to stakeholders is what separates a TNA that drives budget and action from one that ends up in a shared drive nobody opens again. This guide covers the narrative structure, a ready-to-use slide deck framework, an executive summary template, real scenario examples, a corrected ROI formula, objection-handling scripts, and an FAQ section covering the questions people search most often around presenting TNA findings to senior management.
If you’ve ever sat through twenty minutes of polite nodding followed by “thanks, we’ll circle back,” this is for you.
What Is a TNA Presentation?

A TNA presentation is a structured communication of training needs analysis findings to stakeholders, designed to explain business problems, root causes, recommendations, and expected outcomes in a way that supports decision-making. It is not a report readout — it’s a case for action, built to get a specific approval rather than simply share information.
The T.R.U.S.T Framework for Presenting TNA Results
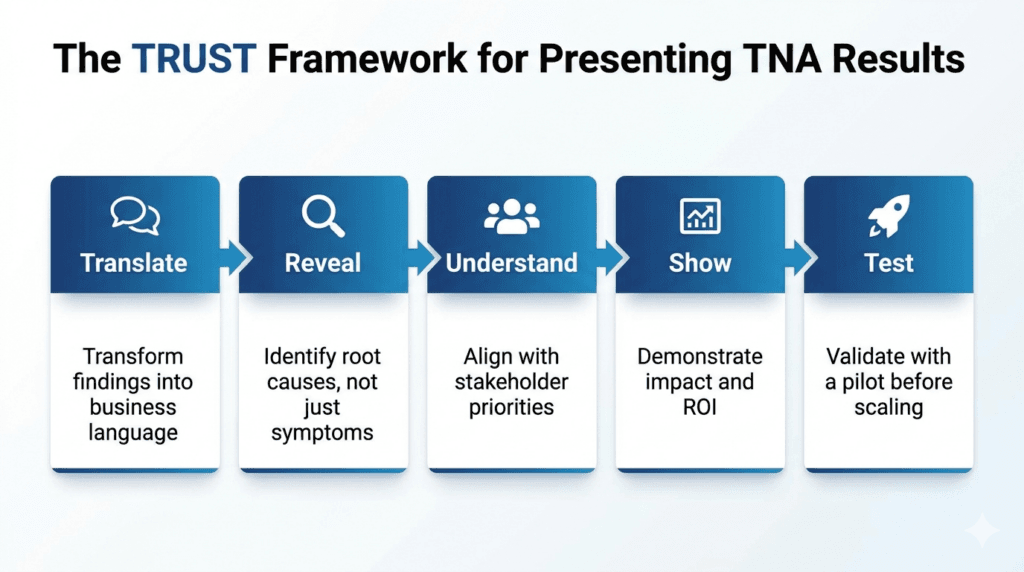
Most advice on this topic is a list of disconnected tips. After enough rooms, a pattern emerges that holds regardless of audience or industry — five moves, in order:
- T — Translate findings into business language before you build a single slide
- R — Reveal root causes, not just symptoms
- U — Understand stakeholder priorities before you walk in (a CFO and a COO are listening for different things)
- S — Show projected impact, including a realistic ROI range
- T — Test through a pilot rather than asking for full-scale approval upfront
Every section below maps to one of these five moves. If you only remember one thing from this article, remember TRUST — it’s the order that matters as much as the content.
Why Good TNA Data Still Fails to Land
Most L&D professionals present their TNA the way they conducted it — methodically, comprehensively, starting from process. Senior stakeholders didn’t sit through the surveys. They walk in with fifteen minutes of attention, a dozen competing priorities, and a mental filter tuned to one question: does this affect the business, and what do you want me to do about it?
One pattern I’ve seen repeatedly: presenters spend the first ten minutes of a TNA meeting walking the room through survey methodology — sample size, instrument validity, response rate. By slide three, people are checking their phones. The pattern almost always breaks the same way: a senior leader interrupts, flatly, with “I understand how you collected the data, but what exactly are you asking us to do?” That question is the whole problem in one sentence. Lead with the business problem, put methodology in the appendix, no exceptions.
There’s a second, quieter failure mode worth naming: presenting a TNA as a request for permission rather than a recommendation backed by evidence. Stakeholders can sense the difference. A presenter who walks in asking “what do you think we should do?” hands the room the burden of solving a problem they didn’t analyze. A presenter who walks in saying “here’s what we found, here’s what we recommend, here’s what we need from you to move forward” keeps the burden of analysis where it belongs — with the person who did the work — and gives leadership a much smaller, faster decision to make.
Sample Opening Script
The first thirty seconds set the tone for everything that follows. A workable opening:
“I want to start with the business problem, not the data behind it. [State the problem in one sentence, with one number.] We ran a structured analysis to understand why, and I want to walk you through three findings, the root cause behind them, and a specific recommendation — including cost and a way to validate it before we scale anything.”
This does three things immediately: it signals you respect their time, it frames the meeting as a decision rather than a data dump, and it tells them exactly what’s coming so they’re not guessing.
Understand the Executive Mindset First
Senior leaders don’t buy training, they buy outcomes. Before you build a single slide, translate every finding into the language of the business case: efficiency, revenue, retention, risk mitigation, and customer experience. This is the Translate step in the TRUST framework, and it’s the highest-leverage move in presenting TNA findings to senior management.
A few reframes that consistently work:
- Instead of “70% of sales reps lack consultative selling skills,” try “we’re likely leaving deals on the table in 7 out of 10 sales conversations.”
- Instead of “managers report low confidence in giving feedback,” try “unresolved performance issues are probably contributing to the 18% turnover we saw in that division last quarter.”
- Instead of “employees want more onboarding support,” try “new hires are taking longer to reach full productivity than industry benchmark, which extends our time-to-revenue.”
The underlying data hasn’t changed — only the framing has. Anchor each reframed point to the relevant level of training needs analysis (organizational, job/task, or individual) so stakeholders understand where the finding sits.
What Executives Care About, by Function
This is the Understand step in TRUST, and it’s worth doing before you write a single slide, not after. The same finding lands differently depending on who’s in the room — pitch a CFO and a CHRO the same way and you’ll lose at least one of them.
- CFO — Cares about cost, ROI, and payback period. Lead with the financial case; methodology and process detail can wait.
- COO — Cares about productivity, quality, and operational efficiency. Lead with throughput, error rates, or cycle time.
- CHRO — Cares about retention, engagement, and internal mobility. Lead with attrition risk and the cost of replacing skilled people.
- Sales VP — Cares about conversion, revenue, and pipeline health. Lead with win rate or deal size, not skill labels.
- Customer Service Leader — Cares about CSAT, escalations, and resolution time. Lead with the customer-facing number, not the training activity behind it.

If your audience is mixed — which it usually is — open with whichever language applies to the most senior or most skeptical person in the room, then touch the others briefly as you move through findings.
Executive Summary Template
This single slide often determines whether the rest of the deck gets attention at all, which is why it comes before the deck structure, not after. Keep every field to one line.
What is an executive summary in TNA? An executive summary is a one-page overview of the business problem, root causes, recommendations, costs, and expected results of a training needs analysis. It allows leaders to understand the findings without reviewing the full report.
Executive Summary Template
- Problem: New hires take 120 days to reach full productivity.
- Root Cause: Inconsistent onboarding process across regions.
- Impact: Delayed revenue generation; estimated ₹1.5–2L per new hire in lost productive time.
- Recommendation: 30-day structured onboarding academy.
- Cost: ₹2,00,000 (pilot, two teams)
- Success Metrics: Time-to-productivity, 90-day attrition, manager satisfaction score
Copy this structure directly into slide one of your deck — problem, root cause, impact, recommendation, cost, success metrics — and fill in your own numbers.
The “Before, During, After” Narrative Structure

This is the simplest reliable way to carry an executive from skepticism to agreement in a short window.
Before — Establish the current state in two or three sentences with one supporting number. The goal: heads nodding, “yes, that matches what I’m seeing.”
During — Walk through three to five findings, each built the same way: the business symptom leadership already worries about, the supporting data point, and the root cause your analysis uncovered. This is the Reveal step in TRUST — context beats volume every time.
After — End with a specific recommendation. Not “we should invest in training,” but “a focused six-week coaching program for first-line managers in Operations, piloted with two teams before a company-wide rollout.”
How to Structure Your TNA Presentation Deck
This is the part most TNA presentations get wrong: too many slides, too much methodology, not enough narrative. Use this as a starting template and adapt the slide count to your time slot — even a 10-minute slot can run this structure compressed into 5–6 slides.
10-Slide TNA Presentation Structure
- Executive Summary — The whole story in one slide (use the template above)
- Business Problem — The “Before” state, framed in business terms
- Current Performance Data — One or two charts, not a data dump
- Methodology (brief) — One line: what you did, who you talked to, how confident the data is
- Key Findings — Three to five findings max, each with a one-line “so what”
- Root Causes — Why the problem exists, not just that it exists
- Recommendations — Specific, named, scoped
- Cost vs. Benefit — Including the ROI projection (see below)
- Pilot Plan — Phased rollout, timeline, success metrics
- Next Steps — The single, explicit ask
If you’re building this for the first time, our training needs analysis template walks through the underlying data structure that feeds slides 3–7.
Internal Resource: To read the complete guide on TNA template and to download the free template, please read: Training Needs Analysis Template
Real Examples: Presenting TNA Results by Function
Generic advice only goes so far. Here’s how the same structure plays out across three common scenarios.
Example 1: Presenting to a Sales Leadership Team
- Before: Win rates have dropped 12% quarter-over-quarter in a segment that used to convert reliably.
- During: Call recordings and manager shadowing show reps defaulting to feature-dumping instead of diagnosing the buyer’s problem — a consultative-selling skills gap, not a market problem.
- After: A two-week consultative selling intensive for the underperforming segment, piloted with the two lowest-converting teams, measured against win rate and average deal size over the following quarter.
Sales leaders respond fastest to pipeline and win-rate language — lead with the number, not the skill. Notice what’s absent from this example: there’s no mention of “training hours” or “course completion.” A sales leader reading those terms mentally files the request under overhead. A sales leader reading “win rate” and “deal size” mentally files it under pipeline — and pipeline gets budget approved faster than almost anything else in a commercial organization.
If the room pushes back with “maybe it’s just a tough quarter,” that’s your cue to surface the supporting evidence — the specific behavior pattern observed across multiple reps and teams, not isolated to one underperformer. A pattern across people is a skills gap; a dip in one person’s numbers is a performance management conversation, and it’s worth being precise about which one you’re presenting.
Example 2: Presenting to a Customer Service Leadership Team
- Before: Average handling time is rising and CSAT is slipping in the same quarter new product lines launched.
- During: Frontline agents report confidence gaps specifically on the new product lines, not on legacy processes — confirmed by a spike in escalations tagged “product knowledge” in the ticketing system.
- After: A focused product knowledge refresh tied to each launch cycle going forward, not a generalist retraining program — narrower scope, faster approval.
This example also illustrates a useful principle: the narrower and more clearly bounded the recommendation, the easier it is to approve. “Retrain the entire service team” sounds expensive and vague. “Add a 90-minute product briefing to every future launch checklist” sounds like a process fix that happens to involve training — and process fixes get approved with far less friction than training programs do.
Example 3: Presenting to a Manufacturing Operations Team
- Before: Near-miss safety incidents have ticked up on one production line over two consecutive months.
- During: Root cause analysis shows the line absorbed three transferred operators who didn’t receive equipment-specific training — a job/task-level gap, not a culture or compliance failure.
- After: A mandatory equipment-specific certification step before any operator transfer, closing the gap structurally rather than relying on a one-time retraining push.
Operations and safety stakeholders respond to risk-mitigation framing faster than almost any other angle — lead there. Safety-adjacent findings carry a built-in urgency most other TNA findings don’t, but that urgency can backfire if the recommendation feels reactive rather than structural. Framing the fix as a permanent step in the transfer process — not a one-off retraining session in response to this specific incident — signals that the gap is closed for good, not patched until the next near-miss.
Data Visualization & Storytelling
Senior stakeholders are visual, fast, and easily fatigued by clutter. The chart you pick matters as much as the data inside it — the wrong chart for the question forces the room to do mental translation work they shouldn’t have to do.
Best Charts for TNA Presentations
| Business Question | Recommended Chart |
| Skill gaps across roles or teams | Horizontal bar chart |
| Turnover or performance trends over time | Line chart |
| Regional or team comparisons | Heat map |
| Before vs. after a planned intervention | Clustered bar chart |
| Cost vs. benefit breakdown | Waterfall chart |
| Prioritizing multiple findings | 2×2 matrix (impact vs. effort) |
Drop from the main deck:
- Raw survey question breakdowns — summarize the takeaway instead
- Methodology details and statistical caveats — move to an appendix slide
- Anything that takes more than 15 seconds to interpret at a glance
If your organization already has a learning analytics dashboard, pull a single relevant view into the deck rather than rebuilding it as a static chart — it signals the data is live and monitored, not a one-time snapshot.
How to Show Training ROI Before Implementation
Executives mention cost almost automatically. If you don’t address ROI before they ask, you’ve already lost ground. This is the Show step in TRUST.

It’s worth being precise about the formula here, because getting it wrong undermines credibility fast — and ROI is one number a CFO in the room will mentally recalculate in real time.
ROI (%) = ((Benefits − Costs) ÷ Costs) × 100
Example:
- Benefits (reduced error-related cost): ₹10,00,000
- Training cost: ₹2,00,000
- ROI = ((10,00,000 − 2,00,000) ÷ 2,00,000) × 100 = 400%
A common error is dividing benefit by cost without subtracting cost first — that calculates a benefit-to-cost ratio, not ROI, and it inflates the number. In the example above, benefit-to-cost gives 500%, which overstates the case and is the kind of mistake a finance stakeholder will catch instantly, often in front of the room. Getting the formula right the first time matters more than getting an impressive-looking number.
Two caveats worth stating out loud in the room, not hiding: first, that the benefit figure is an estimate based on current cost data, not a guarantee — overstating confidence here tends to backfire harder than a modest, well-labeled projection. Second, that the pilot phase exists specifically to test this number before any larger investment is made. Stakeholders are far more comfortable with an imperfect estimate they know will be validated than a confident number with no plan to check it.
Handling “The Grilling”: Scripts for Tough Questions
The tough questions are predictable. Prepare for them, and Q&A becomes your strongest moment instead of your weakest.
- “Isn’t this just a management problem?” “You’re right that management plays a role — our recommendation includes equipping managers directly. But the data shows the gap is structural: new hires across multiple teams hit the same wall regardless of who manages them. That points to a systemic fix, not just individual coaching.”
- “Do we really need to spend money on this right now?” “The gap is already costing us [specific metric]. The pilot we’re proposing costs less than what we lost last quarter to [specific example]. We’re not asking you to absorb new risk — we’re asking you to reduce an existing one.”
- “How do we know this will actually work?” “That’s exactly why we’re proposing a pilot with two teams rather than a full rollout, measured against these three indicators before we recommend further investment.”
- “Why didn’t we know about this sooner?” “This is precisely what the analysis was designed to surface. The good news is we now have visibility we didn’t have before, and a clear path forward.”
A reliable framework for anything unexpected: Acknowledge → Reframe → Evidence → Next step.
A harder one worth preparing for specifically: occasionally a stakeholder will ask a number-precision question you genuinely can’t answer on the spot — “where exactly does that ₹10 lakh figure come from?” The instinct to bluff a confident-sounding answer is strong, and it’s almost always the wrong move; a confidently wrong number, caught later, costs far more credibility than an honest “I’ll confirm that exact breakdown and send it to you by end of day.” Stakeholders forget a follow-up email. They don’t forget being given a number that turned out to be wrong.
Common Mistakes to Avoid
- Leading with methodology instead of the business problem — by the time you get to “why this matters,” the room has tuned out
- Showing every chart you built — more data does not equal more credibility; it equals more confusion
- Vague recommendations (“more training”) instead of named, scoped programs
- No cost counterweight — mentioning cost without an ROI projection invites the room to anchor on cost alone
- Asking for full rollout approval upfront instead of a pilot — this raises perceived risk unnecessarily
- No clear single ask on the final slide — if the room isn’t sure what you want them to approve, they’ll default to “let’s circle back”
- Treating every stakeholder in the room the same way — a CFO and a department head are listening for different things; if you only prepared one angle, you’ve only prepared for half the room
- Skipping the rehearsal — the Q&A scripts above only work if they’ve been said out loud at least once before the real meeting; reading them cold in the moment rarely lands with the same confidence
Metrics Executives Actually Care About
Not every metric your TNA produced belongs in front of leadership. Prioritize:
- Time-to-productivity (especially for onboarding-related findings)
- Attrition / retention, particularly in the affected team or function
- Error rates, rework, or compliance incidents
- Conversion or win-rate movement, for revenue-facing teams
- Customer satisfaction (CSAT/NPS) where service quality is implicated
- Projected ROI, calculated correctly and labeled as an estimate
If a metric you measured doesn’t map to one of these categories, it’s probably appendix material, not main-deck material.
Reduce Perceived Risk With a Phased Roadmap
This is the Test step in TRUST, and stakeholders approve contained, reversible commitments far more readily than sweeping ones.
- Phase 1 (Pilot): Small, time-boxed, with one or two teams and a fixed review date
- Phase 2 (Refine): Adjustments based on pilot data, expanded to a broader group
- Phase 3 (Scale): Full rollout, justified by the pilot’s own data
This isn’t only a presentation tactic — it gives you real evidence to strengthen your case at the next checkpoint.

Adapting the Structure for a 5-Minute Update
Not every TNA presentation gets a 15-minute slot. Sometimes you get five minutes in a standing leadership meeting, sandwiched between two other agenda items. The structure still holds — it just compresses.
In a 5-minute version, the executive summary slide effectively becomes the entire presentation: problem, root cause, impact, recommendation, cost, and success metrics, delivered verbally in roughly that order, in under two minutes. The remaining time goes to one supporting data point and the single ask. Save the full deck — findings, root causes, ROI detail, pilot plan — for a follow-up document you can send afterward or a longer session if they ask for one. The goal of a 5-minute slot isn’t to convince; it’s to get a “yes, let’s go deeper” or a “yes, run the pilot.” Treat it as a gate, not the whole argument.
Bad TNA Presentation vs. Good TNA Presentation

| Element | Bad Presentation | Good Presentation |
| Opening | Methodology and sample size | The business problem, in one line |
| Data | Every chart from the full analysis | Three to five findings, each with a “so what” |
| Language | “Skills gap,” “learning intervention” | Revenue, retention, risk, cost |
| Recommendation | “We should invest in training” | A named, scoped program with a cost |
| Cost framing | Cost mentioned with no counterweight | Cost paired with a correctly calculated ROI |
| Ask | Full-scale rollout | A bounded pilot with success metrics |
| Q&A | Defensive, reactive | Acknowledge → Reframe → Evidence → Next step |
TNA Presentation vs. TNA Report
These two deliverables serve different purposes, and conflating them is part of why some TNA presentations run long and lose the room. The report is the reference document; the presentation is the approval document.
| TNA Report | TNA Presentation |
| Detailed | Concise |
| 30–50 pages | 10 slides |
| Data-focused | Decision-focused |
| Methodology-heavy | Business-heavy |
| Reference document | Approval document |
Build the report first — it’s where the rigor lives, and it’s what you hand over when someone asks for the detail behind a slide. Build the presentation second, treating the report as raw material to be translated, not a script to be read aloud.
Your Presentation Checklist (Cheat Sheet)
- Opening line states the business problem, not the research process
- Every finding reframed in terms of cost, risk, revenue, or retention
- Stakeholder-specific framing prepared for each function in the room (CFO, COO, CHRO, etc.)
- Structure follows Before → During → After
- No more than 5 key findings in the main deck
- Executive summary slide completed (problem, root cause, impact, recommendation, cost, metrics)
- ROI calculated correctly — (Benefits − Costs) ÷ Costs × 100 — and included alongside cost
- Each chart passes the “15-second” clarity test
- Methodology and raw data moved to an appendix
- A specific, named recommendation — not a vague call for “more training”
- A phased, pilot-first roadmap with clear success metrics
- Prepared answers for the most common pushback questions
- A single clear ask on the final slide
TNA Stakeholder Buy-In Toolkit
Download four editable templates used to present training needs analysis results to executives:
- ✅ Executive PowerPoint Deck Template
- ✅ Executive Summary Template
- ✅ Stakeholder Question Cheat Sheet
- ✅ Training ROI Calculator (Excel)
These resources are designed to help L&D professionals communicate findings, handle objections, and build a stronger business case for training initiatives.
Final Thoughts
Presenting training needs analysis results to stakeholders well doesn’t require a flashier deck — it requires translation, in the order the TRUST framework lays out: translate the language, reveal the cause, understand the audience, show the impact, test before you scale. None of this turns a skeptical room into instant believers overnight, and it shouldn’t promise to. What it does, consistently, is move your TNA out of the drawer and into the decision that actually gets made.
Have a story about presenting TNA results to leadership — a win, a tough question that stumped you, or a lesson learned the hard way? Share it in the comments below; the next person reading this might need it.
Frequently Asked Questions
How do you present training needs analysis results to stakeholders?
Reframe findings in business terms (cost, risk, revenue), structure the story as Before → During → After, limit the deck to your top 3–5 findings, and end with a specific, costed recommendation rather than a general call for “more training.”
What should a TNA report include?
A clear problem statement, the methodology in brief, key findings tied to organizational, job, or individual levels, root causes, a costed recommendation, and proposed success metrics for measuring impact after implementation.
How long should a TNA presentation be?
Aim for 10–15 minutes of presentation time with a 10-slide structure, leaving the remaining time for questions. Detailed methodology and raw data should live in an appendix, not the core deck.
What charts should be used in a TNA presentation?
Horizontal bar charts for skill gaps, line charts for trends, heat maps for regional comparisons, clustered bar charts for before-vs-after, waterfall charts for cost-benefit, and a 2×2 matrix for prioritizing multiple findings.
How do you convince stakeholders to approve training investment?
Pair every cost with a correctly calculated ROI, propose a bounded pilot instead of a full rollout, and prepare direct, business-framed answers to the objections stakeholders raise most often, such as cost and accountability.
How do you calculate ROI before training?
Use ROI (%) = ((Benefits − Costs) ÷ Costs) × 100. Label it clearly as a conservative estimate, and pair it with the evaluation metrics you’ll use to confirm the projection after a pilot.
Further Readings
- Training Needs Analysis: The Complete Guide
- How to Conduct a Training Needs Analysis
- The 3 Levels of Training Needs Analysis
- Skills Gap Analysis vs. Training Needs Analysis
- Job Task Analysis: A Practical Guide
- Performance Consulting Explained: When Training Is NOT the Answer
- Training Needs Analysis Template: 1 Free Download for L&D Teams
- Focus Groups and Interviews for Training Needs Assessment: A Practical Field Guide
- Kirkpatrick Model: How to Measure Training Effectiveness
- Training Needs Analysis Questionnaire: Complete Guide (75 Questions & Free Template)
- Competency Mapping vs Skills Gap Analysis
- Phillips ROI Model Explained: With Examples
References
- Rossett, A. (1987). Training Needs Assessment. Educational Technology Publications.
- Kirkpatrick, J. D., & Kirkpatrick, W. K. (2016). Kirkpatrick’s Four Levels of Training Evaluation. ATD Press.
- Phillips, J. J., & Phillips, P. P. (2016). Handbook of Training Evaluation and Measurement Methods (4th ed.). Routledge.
- Stolovitch, H. D., & Keeps, E. J. (2002). Telling Ain’t Training. ATD Press.
- Nussbaumer Knaflic, C. (2015). Storytelling with Data: A Data Visualization Guide for Business Professionals. Wiley.
- Duarte, N. (2010). Resonate: Present Visual Stories that Transform Audiences. Wiley.
- Heath, C., & Heath, D. (2007). Made to Stick: Why Some Ideas Survive and Others Die. Random House.
For additional frameworks on connecting learning data to business outcomes, ATD, Kirkpatrick Partners, and Harvard Business Review have published extensively on stakeholder communication and learning ROI.
Author Details

Anupama Mitra is a learning experience designer, writer and facilitator with a deep interest in how people learn, adapt and grow at work. With over a decade of experience in corporate learning and development, she specializes in simplifying complex ideas into practical, actionable insights.Her work focuses on leadership development, behavioral changes, making workplace learning more human and engaging. You can reach out to her at anupama@trainercentric.com