A complete framework for calculating the financial return on training and development investment.
Introduction to Phillips ROI Model
Picture this: your organization just wrapped up a leadership development program that ran for six months, involved 40 senior managers, and cost close to a quarter of a million dollars once you account for facilitator fees, travel, technology, and lost productive time. The feedback forms come back glowing. Participants say the sessions were engaging. Their managers say people “seem more confident.” Everyone nods along in the wrap-up meeting.
Then the CFO asks one question: “What did this actually do for the business?”
Silence.
This scene plays out in conference rooms everywhere, and it’s the exact gap the Phillips ROI Model was built to close. Reaction scores and completion certificates used to be enough to justify a training budget. They aren’t anymore. Executives increasingly want evidence — not impressions — that learning investments produce measurable business outcomes: more sales, fewer errors, better retention, faster onboarding, safer operations.
| Quick Answer: What Is the Phillips ROI Model? The Phillips ROI Model is a five-level training evaluation framework, created by Dr. Jack Phillips, that extends the Kirkpatrick Model by adding a fifth level — a calculated financial return on investment (ROI) for a training program, expressed as a percentage. |
This guide goes beyond the standard explanation you’ll find elsewhere. Alongside the five levels, formulas, and worked examples, we’ll cover how experienced L&D teams actually decide when to run a full ROI study (and when not to bother), what ROI looks like when it isn’t purely financial, and the misconceptions that quietly derail most attempts at this model.
What Is the Phillips ROI Model?
The Phillips ROI Model (also called the Phillips ROI Methodology) is a five-level framework for evaluating training and development programs, culminating in a calculated return-on-investment percentage. It was created by Dr. Jack J. Phillips, who began developing the approach in 1973 while working as an engineer at what was then Lockheed Aircraft, training test pilots on the electrical and avionics systems of the C-5A Galaxy. Phillips later formalized the methodology in his book Return on Investment in Training and Performance Improvement Programs, published in 1980.
If you’re new to training evaluation, here’s the simplest way to think about the Phillips ROI Model for beginners: it takes the four-level evaluation framework most L&D professionals already know from Donald Kirkpatrick — reaction, learning, application, and business results — and adds a fifth level that converts business results into money, then compares that monetary benefit against the cost of the program. It sits at the far end of the instructional design lifecycle — a natural companion to the broader instructional design models that shape how a program is built in the first place, since a program designed without clear objectives is one no evaluation model can rescue later.
Kirkpatrick’s model, first introduced in the late 1950s and refined through the following decades, was never designed to produce a financial ROI figure. Its fourth level, “Results,” asks whether the training affected organizational outcomes like productivity or quality, but it stops short of putting a currency symbol in front of the answer. Phillips saw that gap and built a process specifically to close it — isolating the effect of training from other factors, converting the isolated effect into a monetary value, and dividing that by program cost to produce a real ROI percentage, the same way a CFO would evaluate any other capital investment.
That’s why the ROI Institute — the organization Phillips and his wife and co-researcher, Patti Phillips, founded to advance the methodology — describes Level 5 as the piece that finally lets learning compete for budget on the same terms as marketing, IT, or operations investments.
| Get the companion calculator This guide comes with a free Phillips ROI Calculator (Excel) — enter your program costs and business impact, and it automatically calculates Net Benefits, ROI%, Benefit-Cost Ratio, and Payback Period, plus a Level 5 data-collection readiness checklist. Download it and use it alongside the worked example later in this guide. |
Why Measuring ROI Matters in Corporate Learning
L&D budgets have grown substantially over the past decade, and with that growth has come more scrutiny. Boards and finance leaders who once treated training as a fixed cost of doing business now expect it to be justified the way any other capital allocation is justified.
A few forces are driving this shift:
- CFOs increasingly sit at the table for L&D decisions. Training budgets compete directly with other investments a business could make, and finance leaders want comparable metrics — not just satisfaction scores.
- HR and L&D are under pressure to operate like a data-driven function. Talent analytics, workforce planning, and skills intelligence have all matured, and evaluation is expected to keep pace. The Association for Talent Development has tracked this shift for years through its industry benchmarking research, consistently finding that measurement maturity — not program volume — separates the L&D functions executives trust from the ones they don’t.
- Standards bodies are formalizing the expectation. ISO 30414, the international standard for internal and external human capital reporting published by ISO/TC 260, explicitly lists training and development effectiveness among the metrics organizations are guided to track and disclose — a sign that “did the training work, and was it worth it” has moved from a nice-to-have question to something approaching a reporting obligation for larger organizations.
- Budget justification has become existential for L&D teams. In tighter economic cycles, the programs that survive are the ones with a business case attached, not just an attendance list.
| TrainerCentric Tip Don’t wait for the CFO to ask the question. If you’re only pulling together cost and impact data after finance asks for it, you’re already reconstructing a case instead of building one. Bake the business objective and baseline metric into program design from day one — not into the evaluation plan after the fact. |
None of this means every program needs a full ROI study — Phillips himself has been explicit that most don’t. But it does mean L&D leaders need at least one rigorous, defensible model in their toolkit for when the stakes (and the price tag) are high enough to warrant it.
The Five Levels of the Phillips ROI Model Explained
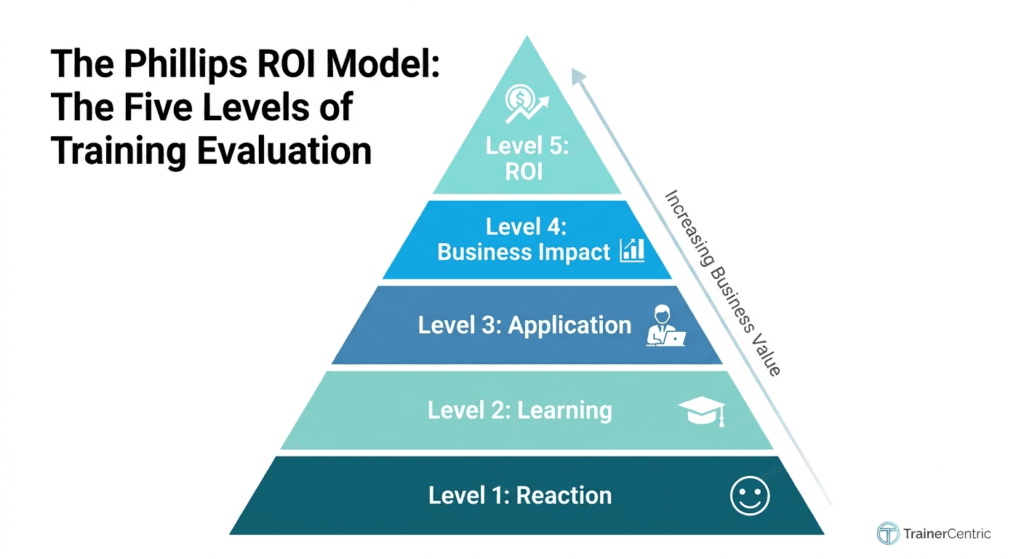
The five levels build on each other. Each one answers a different question, and the data collected at earlier levels feeds into the credibility of the ROI figure calculated at Level 5.
Level 1 – Reaction (and Planned Action)
What it measures: How participants felt about the training and, importantly, what they intend to do differently as a result.
This is the level most organizations already measure, usually through a post-session survey. Phillips’s version of Level 1 goes a bit further than a generic “smile sheet” — it asks not just “did you like it” but “do you plan to apply this, and what specifically will you do.”
Typical metrics: Relevance of content, quality of facilitation, perceived usefulness, intent to apply, Net Promoter-style satisfaction scores.
Data sources: Post-session surveys, exit polls, quick digital feedback forms embedded in an LMS.
Level 1 data is cheap and fast to collect, but on its own it tells you almost nothing about business impact — which is exactly the trap the CFO’s question in our opening scenario is calling out.
Level 2 – Learning
What it measures: Whether participants actually gained the knowledge, skills, or confidence the program was designed to build.
Typical metrics: Pre/post assessment score gains, skills demonstrations, certification pass rates, self-reported confidence shifts, simulation performance.
Data sources: Knowledge checks, role-plays, case study evaluations, practical skills tests, peer or facilitator observation during the session itself, LMS quiz and assessment reports.
One of the more common mistakes we see L&D teams make at this level is relying on a single post-test score. A pre/post design — testing before and after the intervention — is what actually demonstrates a learning gain rather than just a level of knowledge at one point in time. This also connects back to how the program was designed in the first place: assessments that respect adult learning principles — relevance, autonomy, and application over rote recall — tend to produce Level 2 data that holds up better under later scrutiny than a straightforward multiple-choice quiz.
Level 3 – Application (Behavior Change)
What it measures: Whether people are actually using what they learned back on the job. This is where most evaluation efforts historically fell apart, because it requires following up weeks or months after the session ends.
Data sources:
- Manager observations and structured check-ins
- Follow-up surveys sent 30, 60, or 90 days post-training
- Performance support usage data (job aids, coaching logs)
- Self-reported application logs from participants
Why it matters: If people never change what they do at work, there’s no realistic path to a Level 4 business result, let alone a Level 5 ROI. Application is the hinge point of the entire model.
Level 4 – Business Impact
What it measures: The effect of that behavior change on organizational KPIs — the metrics a business already tracks for reasons that have nothing to do with training.
Typical KPIs:
- Sales revenue or conversion rates
- Product or service quality (defect rates, rework)
- Productivity (units per hour, cycle time)
- Customer satisfaction or retention
- Error rates and safety incidents
- Employee retention and time-to-productivity for new hires
Data sources: Sales dashboards, CRM reports, quality management systems, customer satisfaction platforms, HRIS turnover and retention data.
The critical discipline at this level is isolating the effect of training from everything else that could plausibly explain a change in the KPI — a new pricing strategy, a market shift, a change in leadership, seasonal effects. Phillips outlines several isolation techniques, including control groups, trend-line analysis, and — most commonly used in practice because it’s the least resource-intensive — participant or manager estimation with a confidence adjustment applied to the estimate.
Level 5 – Return on Investment (ROI)
What it measures: The monetary value of the business impact from Level 4, compared against the fully loaded cost of the program, expressed as a percentage.
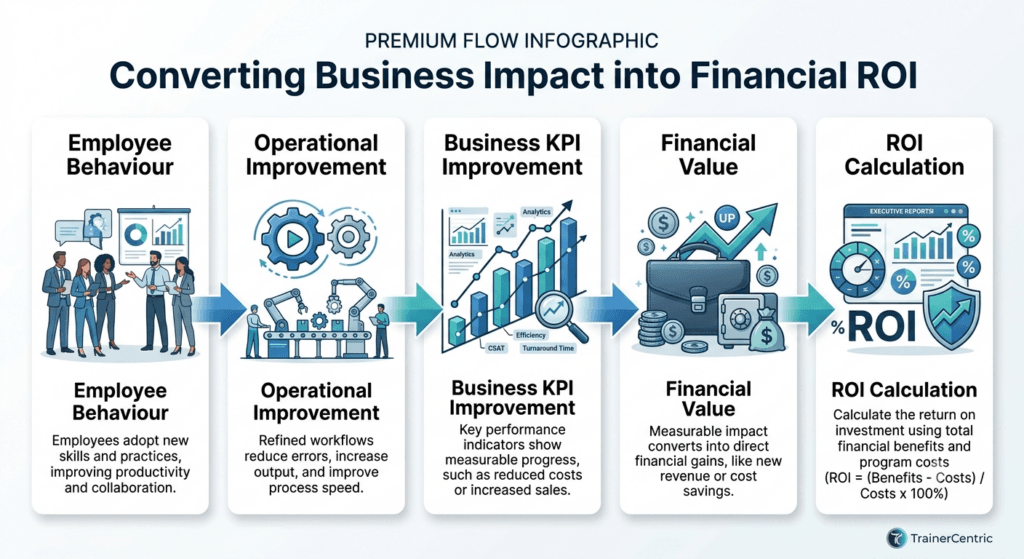
| Quick Answer: What Is Level 5 Evaluation? Level 5 is the calculation stage of the Phillips ROI Methodology. It isolates training’s effect on a business result, converts that effect into a monetary value, and divides the net benefit by the program’s fully loaded cost to produce an ROI percentage. |
This is the level that makes the Phillips model distinct from virtually every other evaluation framework in widespread use. It requires:
- Isolating the training’s effect (carried over from Level 4)
- Converting that isolated effect into a monetary value — for example, translating a 3% reduction in customer churn into a dollar figure using average customer lifetime value
- Tallying the fully loaded program cost — design, delivery, materials, participant salaries for time spent training, travel, technology, and evaluation itself
- Calculating Net Program Benefits (monetary benefits minus program costs)
- Calculating the ROI (%) and, often, a Benefit-Cost Ratio (BCR) alongside it
We’ll walk through the actual formulas and a full worked example below.
How Fortune 500 L&D Teams Actually Use the Phillips Model
Here’s something most articles on this topic skip entirely: large, mature L&D functions almost never run a Level 5 ROI study on every program. They apply it selectively, and the selection logic is itself worth understanding.
In practice, organizations with dedicated measurement teams tend to reserve full ROI studies for a narrow band of programs:
- Leadership development — high cost per participant, high visibility to the board, and directly tied to succession and retention risk.
- Sales enablement — the business impact metric (revenue, conversion rate) is already tracked daily, making isolation and monetary conversion far more tractable than in most other program types.
- Digital transformation and large technical rollouts — expensive, organization-wide, and usually tied to a specific efficiency or cost-avoidance target the business already cares about.
- Graduate and early-career programs — long payback horizon and high per-hire cost make the investment case worth defending in financial terms.
What they don’t do is calculate Level 5 ROI for routine compliance modules, standard onboarding content, or one-off skills workshops — not because those programs don’t matter, but because the cost of a rigorous study would dwarf the value of the insight. ROI Institute recommends reserving a full ROI study for roughly the top 5–10% of programs in a portfolio, ranked by cost and strategic visibility; the rest are evaluated at Levels 1–4, which is usually sufficient to guide decisions.
This selectivity is itself a signal of a mature evaluation practice — not a shortcut. Applying Level 5 everywhere is a good way to burn out a small L&D team and produce ROI figures nobody has time to trust or use.
When to Use — and When NOT to Use — the Phillips ROI Model
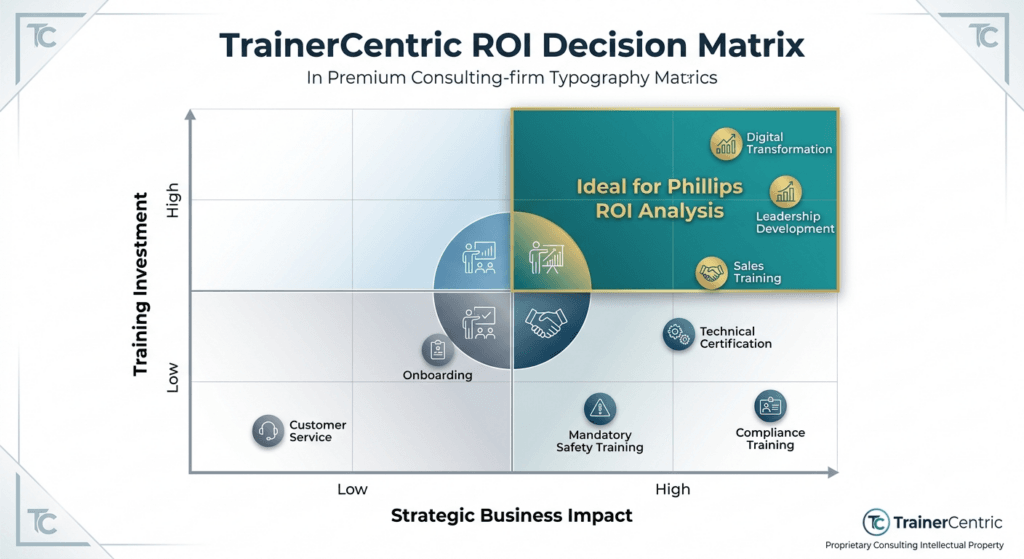
Good candidates for a full Level 5 ROI study:
- Leadership development programs
- Sales training and sales enablement
- Compliance training tied to a clearly measurable risk-reduction outcome (e.g., safety incident rates)
- Customer service initiatives tied to retention or satisfaction metrics
- Large-scale technical or digital transformation training
- Any capability-building initiative involving significant spend across a large population
When a full ROI study is usually not worth it:
- Mandatory compliance refreshers — the business case for running them isn’t ROI, it’s regulatory exposure. Calculating financial ROI on a program you’re legally required to run regardless of outcome adds cost without adding a decision to make.
- Standard new-hire onboarding — valuable, but typically low per-person cost and hard to isolate from dozens of other factors affecting early performance.
- Short, single-session skills workshops — the cost of a rigorous Level 5 study can easily exceed the cost of the program itself.
- Programs where the business KPI can’t be isolated with any credibility — if training coincided with a major process change, leadership transition, or market shift, don’t force a Level 5 number. A Level 3 or 4 evaluation, reported honestly as directional rather than financial, is more credible than a forced ROI figure nobody believes.
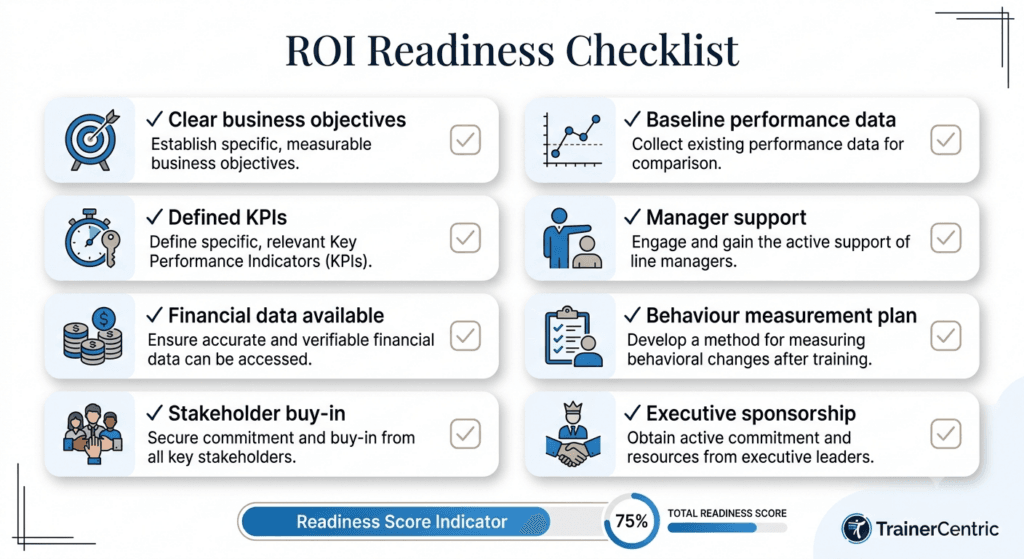
| TrainerCentric ROI Readiness Checklist Before committing to a full Level 5 study, confirm: ✓ Baseline data was captured before training began ✓ A specific business KPI was identified up front ✓ Managers are willing to support follow-up observation ✓ Reliable financial or performance data exists to convert impact into money ✓ Some form of isolation (control group, trend analysis, or credible estimation) is feasible If you can’t check most of these boxes, don’t run the ROI study yet — fix the gaps first, or evaluate at Levels 1–4 instead. |
ROI Isn’t Always Financial
This is the piece the Phillips Methodology gets criticized for skipping, and it’s worth addressing directly: not every legitimate reason to invest in training converts cleanly into dollars, and treating financial ROI as the only valid outcome undersells what learning does for a business.
Experienced L&D leaders often talk about four related but distinct forms of return:
- Strategic ROI — the training’s contribution to a stated organizational priority (e.g., building AI fluency across the workforce ahead of a technology shift), where the value is real but the timeline for financial payback is long or diffuse. ISO 30414 emphasizes this same principle in its human capital reporting guidance — training effectiveness is listed alongside metrics like skills and capability development that aren’t purely financial, precisely because boards need more than one lens on workforce investment.
- Talent ROI — improved retention, internal mobility, and succession readiness. A leadership program that reduces regrettable attrition among high-potential managers has a monetary value, but it’s calculated through retention cost-avoidance, not revenue.
- Innovation ROI — training that builds capability for work that doesn’t exist yet (new product lines, new markets), where the return shows up in future optionality rather than a current-quarter KPI.
- Risk-avoidance ROI — compliance and safety training, where the “return” is a cost or incident that didn’t happen. This is legitimately valuable, but it’s usually better reported as risk exposure reduced rather than forced into a Phillips-style Level 5 percentage.
The practical implication: use the full five-level Phillips Methodology where a financial ROI genuinely serves the decision at hand, and use Levels 1–4 plus a qualitative business case everywhere else. Forcing every program through a financial lens dilutes the credibility of the cases where a hard ROI number is actually the right tool.
The TrainerCentric ROI Decision Matrix
Before committing analyst time to a Level 5 study, it helps to score the program against a small number of factors rather than relying on gut feel. We use a simple decision matrix with our own consulting clients:
| Program Cost | Strategic Importance | Audience Size | Business Impact Visibility | Recommended Evaluation Level |
| Low | Low | Small | Low | Level 1–2 only |
| Low | High | Small | Medium | Level 1–3 |
| Medium | Medium | Medium | Medium | Level 1–4 |
| High | High | Large | High | Full Level 5 ROI study |
| High | Low | Large | Low | Level 1–4; reconsider whether the program is worth the spend at all |
The logic: cost and strategic importance drive whether the investment in measurement is worth it, while business impact visibility determines whether a credible isolation is even possible. A high-cost program with low visibility into its business KPI (the bottom row) is often a signal to fix the measurement plan — or reconsider the program — before spending more money running it again.
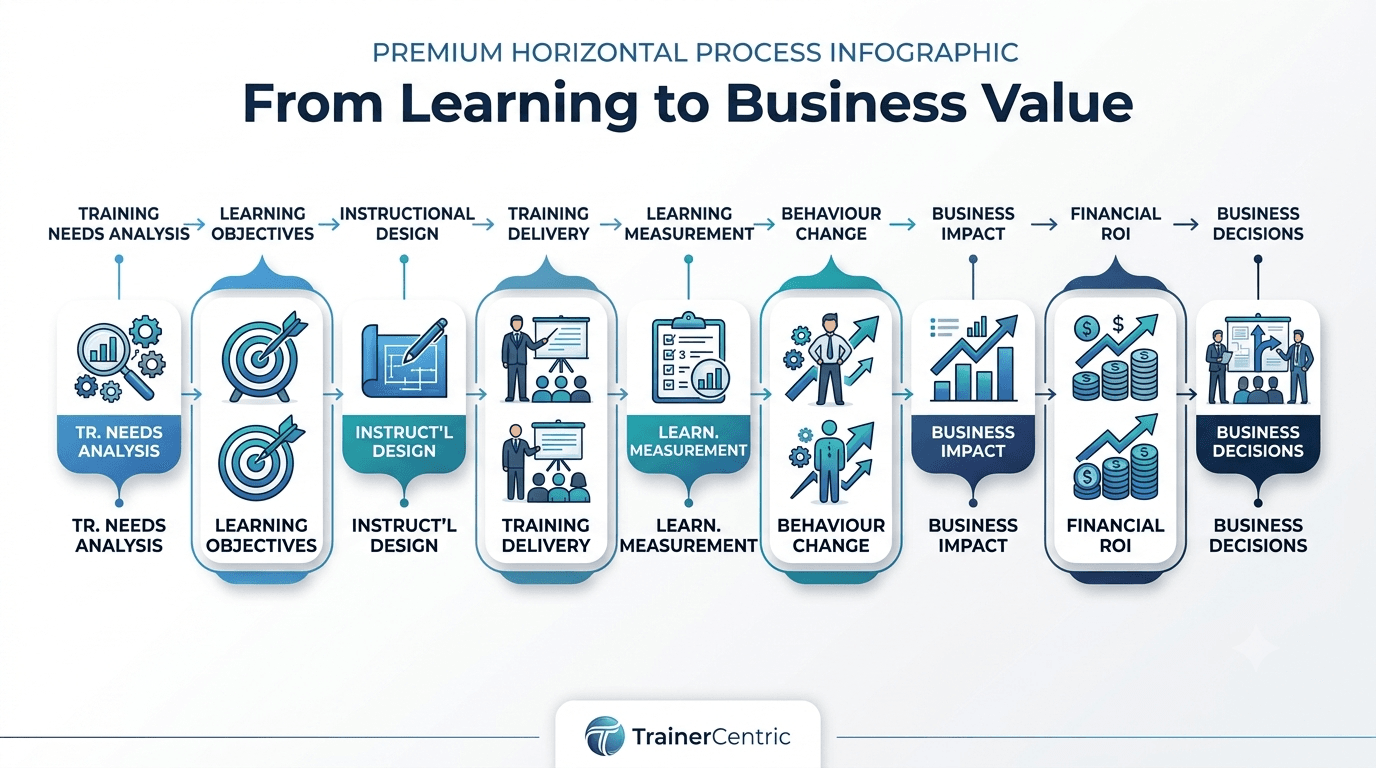
How the Phillips ROI Methodology Works (Step by Step)
In practice, an ROI study following the Phillips Methodology moves through a sequence of stages, typically starting well before the training itself is delivered:
Define business objectives first
Before designing the program, identify the specific business KPI it’s meant to move — a sales number, a quality metric, a retention rate. Vague objectives (“improve leadership”) make everything downstream harder to measure. This is also the point at which a properly sequenced ADDIE design process pays off — the Analysis phase is where the business objective should already be getting defined, not retrofitted after delivery.
Align learning objectives to those business objectives
Each learning objective should have a clear line of sight to the business result you defined in step one. If you haven’t formalized this connection yet, it’s worth revisiting how you write learning objectives using Bloom’s Taxonomy so the link between objective and outcome is explicit from the start.
Collect baseline data before training begins
You cannot demonstrate a change without knowing the starting point. This is the single most commonly skipped step, and it’s the one that quietly undermines the most ROI studies later on.
Measure learning (Level 2)
During or immediately after the program using assessments tied to the stated objectives.
Track workplace application (Level 3)
Through follow-up surveys and manager observation, typically 30–90 days after training ends.
Measure business impact (Level 4)
Against the KPI identified in step one, using the same data sources the business already trusts (sales reports, quality dashboards, HRIS turnover data).
Isolate the effect of training
From other factors using one of the recognized isolation techniques.
Convert the isolated impact into monetary value.
Calculate the ROI
Using the net benefits and program cost.
Report findings
Being explicit about assumptions, confidence levels, and what was and wasn’t included in the calculation. Credibility comes from transparency about the estimate, not from pretending the number is more precise than it is.
| Expert Insight In our experience designing learning strategies, organizations often overestimate the business impact of training because they fail to isolate external variables such as market demand, process improvements, or leadership changes. Applying conservative assumptions may produce a lower ROI figure, but it results in findings that executives are more likely to trust — and a defensible modest number will protect your program’s budget far more reliably than an inflated one that gets challenged in the first review meeting. |
Each of these steps deserves more rigor than a single bullet point, but the sequencing matters as much as the individual techniques: skipping the baseline in step three, for instance, makes it functionally impossible to do a credible isolation in step seven, no matter how sophisticated the later analysis is.
Phillips ROI Model Examples Across Different Training Types
The mechanics of the model stay the same from program to program, but what counts as a credible business KPI — and how hard isolation is — changes a lot depending on the type of training. Here’s how the five levels typically play out across common program types.
Sales Training (Full Worked Example)
Let’s walk through a simplified but realistic example: a sales training program for a 50-person B2B sales team.
Program costs:
| Cost Item | Amount |
| Design and development (external consultant) | $18,000 |
| Facilitator fees (3-day program) | $12,000 |
| Participant salaries for time in training (50 people × 3 days) | $45,000 |
| Travel and venue | $10,000 |
| Technology/LMS hosting | $3,000 |
| Evaluation costs | $2,000 |
| Total Program Cost | $90,000 |
Business results (Level 4), isolated and adjusted:
After the program, the sales team’s average deal-close rate improved. Using participant estimation with a confidence adjustment (a common isolation technique when a control group isn’t feasible), the team estimated that 60% of the improvement was attributable to the training itself, with the rest attributable to a new CRM tool and a seasonal demand increase.
- Total increase in closed revenue over the following quarter: $500,000
- Estimated portion attributable to training (60% isolation factor, adjusted for a 70% confidence level participants assigned to their own estimate): $500,000 × 0.60 × 0.70 = $210,000
- Applying the company’s known profit margin (this step is essential — revenue is not the same as benefit) at 25%: $210,000 × 0.25 = $52,500 in monetary benefit
Calculating ROI:
- Net Program Benefits = Monetary Benefit − Program Cost = $52,500 − $90,000 = –$37,500
- ROI (%) = (Net Program Benefits ÷ Program Cost) × 100 = (–$37,500 ÷ $90,000) × 100 = –41.7%
In this illustrative case, the training shows a negative ROI once costs, isolation, and profit margin are properly applied — a result that would have looked completely different (and misleadingly positive) if the team had simply pointed to the full $500,000 revenue increase without isolating training’s contribution or applying profit margin. This is exactly the kind of correction the Phillips Methodology is built to force, and it’s also why some programs that feel successful on Level 1 and 2 data don’t survive a proper Level 5 analysis. A negative or marginal result isn’t a failure of the methodology — it’s the methodology doing its job by surfacing a business truth that a satisfaction survey never could.
Leadership Development
The business KPI is rarely a single number — it’s usually a blend of retention of high-potential managers, internal promotion rate, and engagement scores of the teams those managers lead. Isolation is harder here than in sales, because leadership behavior change plays out over many months across many teams. Most organizations that run Level 5 studies on leadership programs convert the retention component into money using cost-of-turnover benchmarks (typically 50–200% of an employee’s annual salary depending on role seniority) rather than trying to put a dollar figure on “better leadership” directly.
Compliance and Risk-Reduction Training
As covered above, this is usually a case where Levels 1–4 are sufficient and a full financial ROI isn’t the right tool — the “return” is a risk that didn’t materialize. Where organizations do push to Level 5 (for example, safety training in a manufacturing environment), the conversion typically uses avoided-incident cost data: insurance claims, regulatory fines, or lost-time injury costs from before the program, compared against the same metric afterward.
Customer Service Training
Business KPIs here are usually customer satisfaction (CSAT), first-contact resolution rate, and customer retention. The monetary conversion typically runs through customer lifetime value: a measurable improvement in retention rate is converted into revenue protected, then adjusted for profit margin the same way the sales example above adjusts for margin before finalizing the ROI figure.
Healthcare and Safety-Critical Training
This is where the model looks noticeably different from the sales-and-leadership examples that dominate most articles on this topic. Consider a hospital that introduced a structured medication administration training program for nursing staff after an internal audit flagged a concerning error rate. Following the same five levels: Level 1 reaction data confirmed nurses found the training relevant to their daily workflow; Level 2 assessments showed strong knowledge gains on dosage calculation and verification protocols; Level 3 follow-up audits at 60 days showed nurses consistently using the new double-check procedure; and Level 4 data — pulled from the hospital’s existing incident reporting system rather than any new tracking mechanism — showed a 22% reduction in medication administration errors over the following two quarters.
The monetary conversion here doesn’t run through revenue or profit margin at all — it runs through cost avoidance: the average cost of a medication error event (extended patient stay, remediation, potential liability exposure) multiplied by the number of errors avoided, isolated against a control unit that hadn’t yet received the training. This is a useful reminder that the Phillips Methodology’s monetary conversion step is flexible enough to handle outcomes far removed from a sales floor — the mechanics of isolation and conversion stay the same; only the KPI and the conversion logic change.
Phillips ROI Formula and Calculation
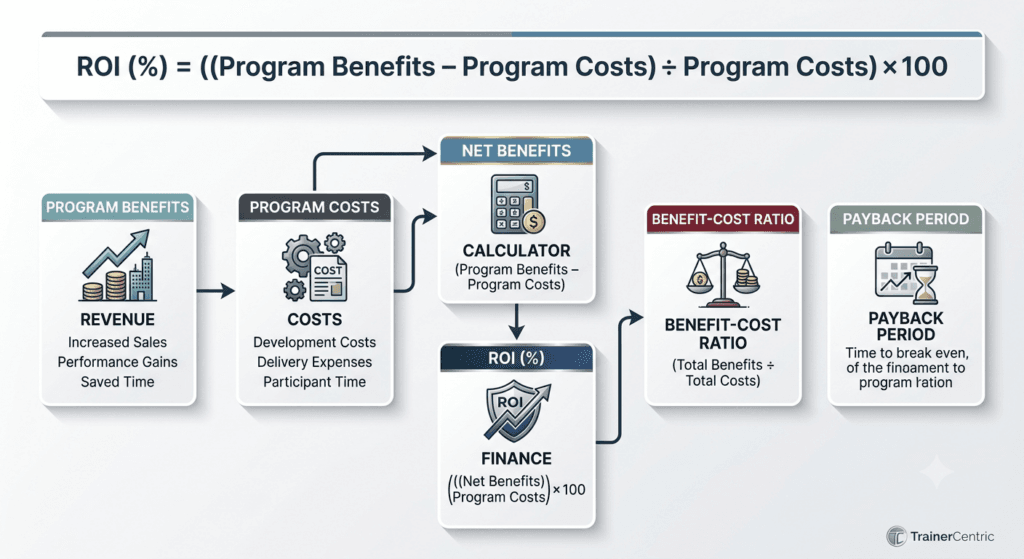
Here are the core formulas, explained plainly.
| Quick Answer: What Is the Phillips ROI Formula? ROI (%) = (Net Program Benefits ÷ Program Costs) × 100, where Net Program Benefits equals the monetary value of the isolated, converted business impact minus the fully loaded program cost. |
Program Costs — the fully loaded cost of the program: design, delivery, materials, participant time (usually calculated as salary plus benefits load for hours spent training), travel, technology, and evaluation itself. Leaving out participant time or evaluation cost is one of the most common ways organizations quietly inflate their ROI.
Program Benefits — the monetary value of the isolated, converted business impact (as shown in the worked examples above).
Net Benefits — Program Benefits minus Program Costs. This is the number that goes in the numerator of the ROI formula, not the raw benefit figure.
| TrainerCentric Tip Never calculate ROI directly from a raw revenue or output increase. Always convert impact into profit or cost-avoidance first — revenue is not the same as benefit, and skipping this step is the single fastest way to produce an ROI figure that won’t survive a finance team’s review. |
Benefit-Cost Ratio (BCR) BCR = Program Benefits ÷ Program Costs
A BCR of 2:1 means the program returned $2 in benefits for every $1 spent. BCR and ROI% communicate the same underlying result in different formats — some executive audiences find the ratio more intuitive, others prefer the percentage.
Payback Period Payback Period = Program Costs ÷ (Monthly or Annual Monetary Benefit)
This tells stakeholders how long it takes for the program to “pay for itself” — a useful complement to ROI% for capital-planning-minded executives.
A quick worked example using different, cleaner numbers to show a positive case: if a program cost $50,000 and produced an isolated, converted monetary benefit of $150,000, Net Benefits would be $100,000, ROI% would be 200%, and the BCR would be 3:1 — meaning $3 returned for every $1 invested.
Data Sources and Tools for ROI Measurement
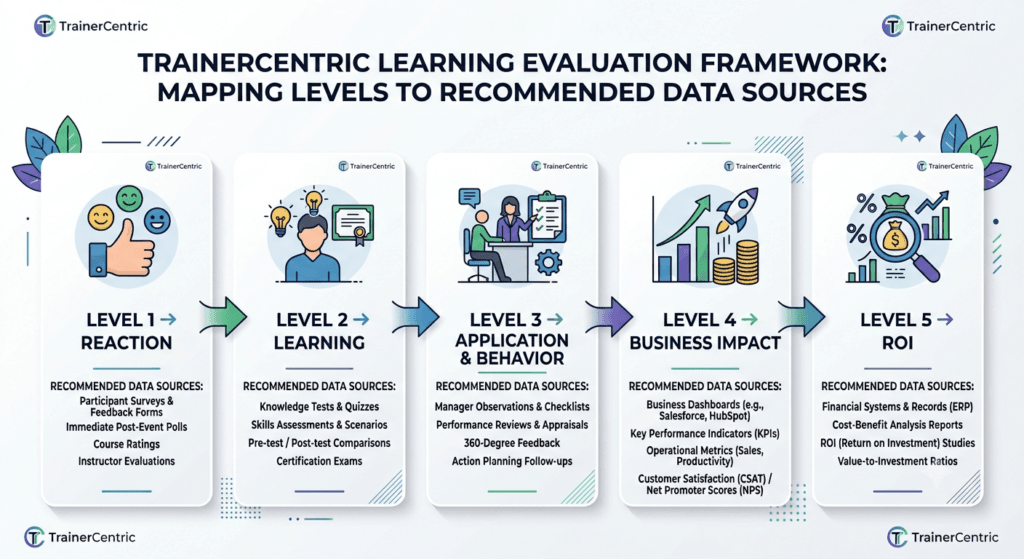
Pulling this off doesn’t require building new systems from scratch — most of the data already exists somewhere in the business. The work is in connecting it.
| Level | Typical Data Source | Common Tools |
| 1 – Reaction | Post-session surveys | LMS survey modules, Google Forms, Typeform |
| 2 – Learning | Assessments, skills demos | LMS quiz reports, assessment platforms |
| 3 – Application | Manager check-ins, follow-up surveys | Survey tools, performance management systems |
| 4 – Business Impact | Sales, quality, retention data | CRM, BI dashboards, HRIS |
| 5 – ROI | Cost and benefit conversion | Spreadsheets (Excel), BI tools, finance system exports |
For most L&D teams, a well-built spreadsheet is still the workhorse for the actual ROI calculation — the complexity is in the isolation logic and monetary conversion assumptions, not in the arithmetic itself. Where BI dashboards and HRIS platforms add real value is in cutting the time it takes to pull Level 4 data, since that’s usually scattered across systems L&D doesn’t own.
If you’d rather not build that spreadsheet from scratch, the free Phillips ROI Calculator linked earlier in this guide handles the Net Benefits, ROI%, BCR, and Payback Period math for you — you only need to supply the cost and business-impact inputs.
Phillips ROI Model vs Kirkpatrick Model
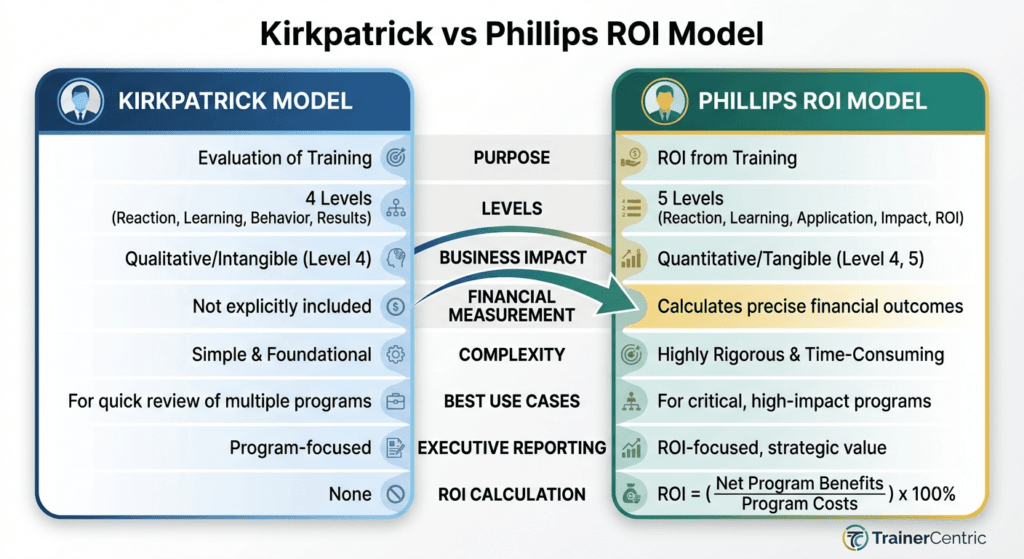
These two models are often discussed as competitors, but that framing is a little misleading — Phillips built his methodology directly on top of Kirkpatrick’s four levels rather than replacing them.
| Dimension | Kirkpatrick Model | Phillips ROI Model |
| Purpose | Evaluate training effectiveness across four levels | Evaluate effectiveness and calculate financial ROI |
| Number of levels | 4 (Reaction, Learning, Behavior, Results) | 5 (adds ROI on top of Kirkpatrick’s four) |
| Business focus | Level 4 addresses organizational results generally | Level 4 plus a dedicated Level 5 for monetary ROI |
| Financial measurement | Not built in | Core feature — isolation, conversion, ROI% |
| Ease of implementation | Simpler; widely adopted as a starting framework | More resource-intensive; requires financial and statistical steps |
| Data requirements | Reaction, test, and observational data | All of Kirkpatrick’s data plus cost data, isolation estimates, monetary conversion factors |
| Executive/CFO reporting | Useful but qualitative at the top level | Speaks directly in the language finance leaders use |
| Strengths | Easy to start, broadly understood, low overhead | Credible financial case, competes for budget against other investments |
| Weaknesses | Stops short of a dollar figure | Time, cost, and expertise required; not worth it for every program |
| When to use | Most programs, ongoing evaluation, smaller initiatives | High-cost, high-visibility, or strategically important programs |
The two models aren’t rivals so much as a base and an extension. Most L&D functions use Kirkpatrick’s four levels as their default evaluation lens day-to-day, then apply the Phillips Level 5 ROI process selectively — typically for the 5–10% of programs, by Phillips’s own estimate, that are expensive or visible enough to justify the additional rigor.
For a full breakdown of the four-level foundation this model builds on, see our complete guide to the Kirkpatrick Model.
Benefits of Using the Phillips ROI Model
- Executive credibility. A defensible ROI% speaks the same language as every other line item the CFO reviews.
- Stronger budget justification. Programs with a Level 5 result behind them are easier to protect — and easier to scale — when budgets tighten.
- Strategic alignment. Because the process starts with defining a business objective, it forces L&D to design with the end business result in mind rather than backfilling justification after the fact.
- Better investment decisions. ROI data helps leaders decide which programs to expand, redesign, or retire.
- Improved accountability. The rigor of isolation and monetary conversion discourages vague, feel-good claims about “impact.”
- Evidence-based learning culture. Even applying pieces of the methodology (without going all the way to Level 5 on every program) tends to raise the overall evaluation maturity of an L&D function.
Challenges and Limitations
The Phillips ROI Model has real, well-documented drawbacks, and it’s worth naming them honestly rather than pretending the process is simple.
- Data collection burden. Levels 3 through 5 require follow-up data weeks or months after training — logistically harder than a same-day survey.
- Time and cost. A full ROI study takes real analyst hours; this is part of why Phillips recommends reserving it for a small percentage of programs.
- Isolating training’s effect from other variables (market conditions, other initiatives, seasonality) is inherently imprecise, even with recognized techniques.
- Converting soft benefits to money — customer satisfaction, morale, engagement — requires judgment calls that some stakeholders will challenge.
- Stakeholder buy-in for a rigorous evaluation process can be hard to secure, especially from sponsors who’d rather not know if the answer might be unflattering.
- Long-term measurement is required for Level 3 and 4 data, which doesn’t fit neatly into quarterly reporting cycles.
- Analytical complexity can make the process feel inaccessible to L&D teams without a data or finance background on staff.
Practical solutions: Partner with finance early so cost and benefit conversion methods are pre-approved rather than debated after the fact. Use conservative estimates and disclose confidence levels rather than presenting a single number as fact. Reserve full Level 5 studies for your highest-cost or highest-visibility programs, and use Levels 1–4 for everything else.
Misconceptions and Implementation Mistakes
Most of what derails a Phillips ROI study falls into one of two buckets: misunderstanding what the model is actually claiming, or executing the mechanics poorly. Worth separating the two.
Common Misconceptions
- “A negative ROI means the training failed.” Not necessarily — it means the training didn’t produce enough isolated, converted financial benefit to exceed its cost. That’s still useful information, and it’s often more about program design or targeting than about whether learning occurred at all.
- “You need a control group to isolate effects.” Control groups are the gold standard, but they’re rarely practical in most corporate settings. Participant and manager estimation, applied with a confidence discount, is a widely accepted and far more common isolation technique.
- “ROI has to be calculated for every program to be credible.” The opposite is closer to the truth — applying Level 5 indiscriminately dilutes credibility, because stakeholders start to notice the numbers are rushed or unsupported.
- “Phillips replaces Kirkpatrick.” It extends it. Every Phillips ROI study still relies on Kirkpatrick’s first four levels as its foundation.
- “A high ROI percentage always means a good program.” A large ROI% on a very small, cheap program can be less strategically meaningful than a modest ROI% on a program tied to a major business priority. Percentage alone doesn’t capture strategic weight.
Common Implementation Mistakes
- Only collecting smile sheets and calling it “evaluation.”
- Skipping baseline data, making later isolation guesswork rather than analysis.
- Poor alignment between learning objectives and business KPIs from the start.
- Trying to measure every program at Level 5, burning out the L&D team and diluting credibility.
- Overestimating benefits by skipping the isolation step or ignoring profit margin when converting revenue figures, as shown in the worked example above.
- Ignoring indirect costs like participant salary time, which can be the largest line item in the cost calculation.
- Weak or overly technical reporting that loses the executive audience instead of building their confidence in the number.
One of the biggest mistakes we’ve seen L&D teams make is collecting evaluation data only after the training ends. By then, nobody remembers the baseline, the isolation estimate becomes pure guesswork, and the resulting ROI figure — however carefully calculated from that point forward — is built on a foundation nobody can defend.
Best Practices for Successful ROI Measurement
- Start measuring during planning, not after delivery. Baseline data has to be collected before the intervention.
- Define the target business KPI before designing the program, not after.
- Partner with finance on cost categories and monetary conversion methods before the study starts.
- Use manager observations as a Level 3 data source — they’re often more credible to stakeholders than self-reports.
- Automate data collection where possible through your LMS, CRM, or HRIS rather than relying on manual surveys alone.
- Focus ROI studies on high-value programs — leadership development, sales enablement, large-scale technical rollouts — rather than trying to calculate ROI for every course in the catalog.
- Measure selectively. Phillips himself suggests only a small fraction of programs warrant a full Level 5 study.
- Communicate findings in the audience’s language — ROI% and BCR for finance, application stories and manager quotes for operational leaders.
The Future of ROI Measurement in AI-Enabled L&D
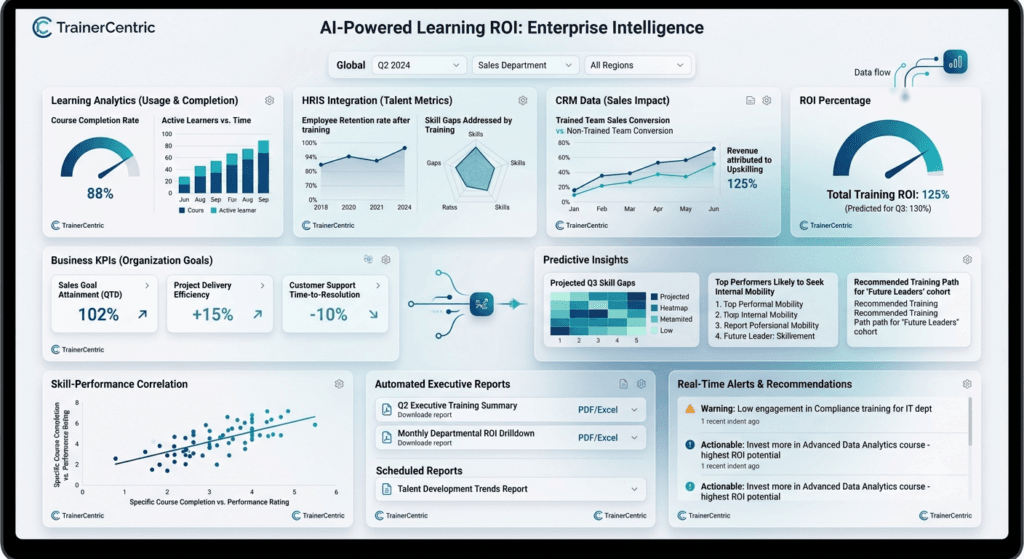
The most time-consuming parts of a Phillips ROI study have never really been the arithmetic — they’re the data-gathering and the judgment calls. That’s the part starting to shift.
A few concrete changes already underway in more mature L&D functions:
- Automated data pulls from CRM and HRIS systems. Instead of an analyst manually exporting quarterly sales figures or turnover data, integrations are increasingly pulling Level 4 business-impact data directly into an evaluation dashboard, cutting the lag between a program ending and its business impact being visible.
- Real-time dashboards instead of quarterly reports. Where ROI reporting used to mean a static document delivered months after a program ended, dashboards that update continuously make it possible to spot an application or business-impact trend early enough to course-correct a program instead of only post-mortem-ing it.
- Learning Record Stores (LRS) and xAPI. Where a traditional LMS captures completion and quiz scores, an LRS using the xAPI specification can capture much richer application-level data — what someone did with a job aid, how they performed in a simulation, how a coaching interaction went — which directly strengthens the Level 3 application evidence a Phillips ROI study depends on.
- Predictive analytics for isolation. Rather than relying solely on participant estimation to isolate training’s effect, some organizations are beginning to use predictive models trained on historical performance data to generate a more defensible counterfactual — what would this KPI likely have done without the training — which is precisely the hardest judgment call in the entire methodology.
None of this removes the human judgment at the center of Phillips’s approach — someone still has to decide what counts as a fair isolation factor and how to convert a soft benefit into money, and that responsibility isn’t going away. But the “an ROI study takes too long and costs too much” objection is getting weaker every year these tools mature, which means more programs — not just the top 5–10% — may become realistic candidates for at least a partial Level 5 analysis over the next few years.
Phillips ROI Model Case Study: Reducing Defects on a Manufacturing Line
Challenge
A mid-sized manufacturing company was seeing a persistent quality defect rate on one of its production lines — high enough that rework costs and customer returns had become a recurring line item in monthly operations reviews. Root-cause analysis pointed to inconsistent operator technique on a recently upgraded piece of equipment, rather than the equipment itself.
Solution
The L&D team designed a targeted operator training program: hands-on technique certification, a job aid posted at each station, and a peer-coaching structure where certified operators supported newer team members during the first few weeks after training.
Evaluation
- Level 1: Post-session surveys showed strong relevance scores — operators said the hands-on format matched how they actually worked, unlike a previous e-learning attempt at the same content.
- Level 2: A practical skills demonstration, not a written quiz, was used to certify technique — appropriate given the physical, procedural nature of the skill.
- Level 3: Floor supervisors conducted structured observations at 30 and 60 days, confirming the new technique was being used consistently, not just during the training session itself.
- Level 4: Defect rate on the line, tracked through the existing quality management system, dropped 18% over the following quarter, compared to a baseline captured in the four weeks before training began.
- Level 5: Using a comparison against a similar line that hadn’t yet received the training as a partial control, the team isolated roughly 70% of the improvement as attributable to the program. Converting avoided rework and return costs into monetary benefit, and comparing that against the fully loaded program cost, produced an ROI of 148%.
Lessons learned
The number that mattered most in the executive readout wasn’t the 148% — it was the baseline. Because the team had insisted on capturing four weeks of pre-training defect data before starting (against some pressure to “just start training now”), the Level 5 isolation held up under scrutiny when the plant manager questioned it. A team that skipped the baseline step would have had a defect-rate story with no credible before-and-after comparison — and, per the common mistakes covered above, an ROI figure nobody could defend in the room where the budget decision actually got made.
Conclusion: What Should You Do Next?
Training should never be treated as a line item to defend on faith. The Phillips ROI Model gives L&D leaders a structured, credible way to show — in the same financial language a CFO already uses for every other investment — how learning contributes to real business outcomes. It isn’t meant for every program, and it isn’t meant to replace the day-to-day evaluation most teams already do.
If you’re just starting to build out your evaluation practice, begin with the Kirkpatrick Model — get comfortable measuring reaction, learning, and application consistently first. Once your organization is reliably capturing Level 3 and 4 data, the Phillips ROI Model becomes the logical next step for the handful of programs where a financial case genuinely matters.
And since a credible ROI figure is only as strong as the objectives you set before training even begins, it’s worth making sure your front-end process is solid too — starting with a properly scoped training needs analysis, objectives built on Bloom’s Taxonomy, and delivery grounded in strong facilitation practice. Get those right, and the ROI number — whatever it turns out to be — will be one your executives actually trust.
Ready to run the numbers on your own program? Download the free Phillips ROI Calculator linked earlier in this guide and work through your own cost and impact data alongside the manufacturing and sales examples above.
Frequently Asked Questions
What is the Phillips ROI Model?
It’s a five-level training evaluation framework, created by Dr. Jack Phillips, that extends Kirkpatrick’s four levels of evaluation with a fifth level calculating the financial return on investment of a training program.
What are the five levels of the Phillips ROI Model?
Reaction, Learning, Application (Behavior Change), Business Impact, and Return on Investment.
Who developed the Phillips ROI Model?
Dr. Jack J. Phillips, who began developing the approach in 1973 and published it formally in his 1980 book on training ROI. He and his wife, Patti Phillips, later founded the ROI Institute to advance the methodology.
What is Level 5 evaluation?
Level 5 is the ROI calculation itself — isolating training’s effect on a business result, converting that effect into monetary value, and comparing it against the fully loaded program cost to produce an ROI percentage.
How do you calculate training ROI?
ROI (%) = (Net Program Benefits ÷ Program Costs) × 100, where Net Program Benefits equals the monetary value of the isolated business impact minus total program costs. See our detailed walkthrough on how to calculate training ROI for a broader look beyond the Phillips-specific approach.
Is Phillips better than Kirkpatrick?
Not better — an extension. Kirkpatrick’s four levels are the foundation; Phillips adds a fifth level for organizations that need a financial ROI figure. Most teams use Kirkpatrick as their default and apply Phillips selectively.
What data is needed to calculate ROI?
Baseline and post-training performance data on the target business KPI, cost data for the full program, an isolation estimate separating training’s effect from other factors, and a monetary conversion factor for the isolated benefit.
Can small organizations use the Phillips ROI Model?
Yes, though smaller organizations typically apply it selectively to their single highest-cost or highest-visibility program rather than across the board, given the time and analytical demands of a full study.
What are the limitations of the Phillips ROI Model?
Data collection burden, the time and cost of a full study, the inherent imprecision of isolating training’s effect from other variables, and the judgment required to convert soft benefits into monetary terms.
How often should ROI be measured?
Not for every program. Phillips’s own guidance is that only a small percentage of programs — the highest-cost, highest-visibility ones — warrant a full Level 5 ROI study; everything else can be evaluated at Levels 1–4.
Is the Phillips ROI Model worth using?
For the right programs — high-cost, high-visibility, strategically important ones — yes, because it produces the one thing a satisfaction score never can: a financial figure the CFO can weigh against other investments. For routine or low-cost programs, the time investment usually isn’t worth it.
Can training have a negative ROI?
Yes, and it’s not necessarily a sign the methodology failed. A negative ROI after proper isolation and monetary conversion often reveals that a program’s cost outweighed its financial business impact — which is exactly the kind of finding that should influence future program design and budget decisions.
What is a good ROI percentage for training?
There’s no universal benchmark, since it depends heavily on program type and industry, but ROI Institute case studies have historically reported ranges from roughly 50% to several hundred percent for well-targeted, high-impact programs. Treat any single benchmark cautiously — the credibility of your own isolation and conversion assumptions matters more than matching an external number.
Is Level 5 mandatory for every training evaluation?
No. Phillips’s own guidance is that only a small fraction of programs — those with high cost, high visibility, or strategic importance — warrant a full Level 5 study. Most programs are evaluated well using just the first four levels.
Note: (One spelling note for search purposes: the framework is named after Jack Phillips, though it’s commonly misspelled as the “Philips ROI Model” — the same spelling as the electronics company, which has no connection to the methodology.)
References
- Return on Investment in Training and Performance Improvement Programs || 3rd Edition || Jack J. Phillips & Patti P. Phillips || Routledge || 2012
- Measuring Return on Investment in Training: A Practical Guide || 1st Edition || Patricia Pulliam Phillips, Jack J. Phillips & William J. Rothwell || American Society for Training & Development (ASTD Press) || 2011
- The Bottomline on ROI: Basics, Benefits & Barriers to Measuring Training and Performance Improvement || 2nd Edition || Patricia Pulliam Phillips & Jack J. Phillips || Association for Talent Development (ATD Press) || 2013
- Handbook of Training Evaluation and Measurement Methods || 3rd Edition || Jack J. Phillips || Routledge || 1997
- Evaluating Training Programs: The Four Levels || 3rd Edition || Donald L. Kirkpatrick & James D. Kirkpatrick || Berrett-Koehler Publishers || 2006
- Evidence-Based Training Methods: A Guide for Training Professionals || 2nd Edition || Ruth Colvin Clark || Association for Talent Development (ATD Press) || 2014
Further Readings
- Kirkpatrick Model: How to Measure Training Effectiveness
- How to Calculate Training ROI Step-by-Step
- Ultimate Guide to Training Needs Analysis
- How to Conduct a Training Needs Analysis
- Skills Gap Analysis vs Training Needs Analysis
- Job Task Analysis
- How to Present TNA Results to Senior Stakeholders
- The 3 Levels of Training Needs Analysis: Organisation, Task & Person Analysis
- ADDIE Model Explained
- Learning Objectives Guide
- Training Needs Analysis Template
- Focus Groups and Interviews
- 12 Facilitation Skills for Corporate Trainers: The Complete Guide
- Training Needs Analysis Questionnaire: Complete Guide (75 Questions & Free Template)
- Questioning Techniques in Training: A Practical Guide for Trainers
Author Details

Tulip Ghosh is a Learning and Development professional who designs impactful, learner-centric experiences rooted in behavioral insight and real-world application. She is passionate about improving learner engagement and translating complex ideas into practical training solutions. A thoughtful writer at heart and with experience of a decade in Learning and Development domain, she brings a simple, grounded perspective to the evolving world of workplace learning. Reach out to her on her Linkedin Profile from here.