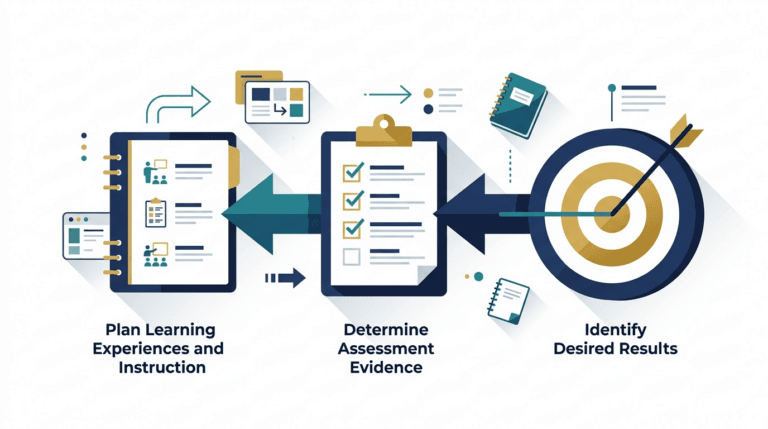
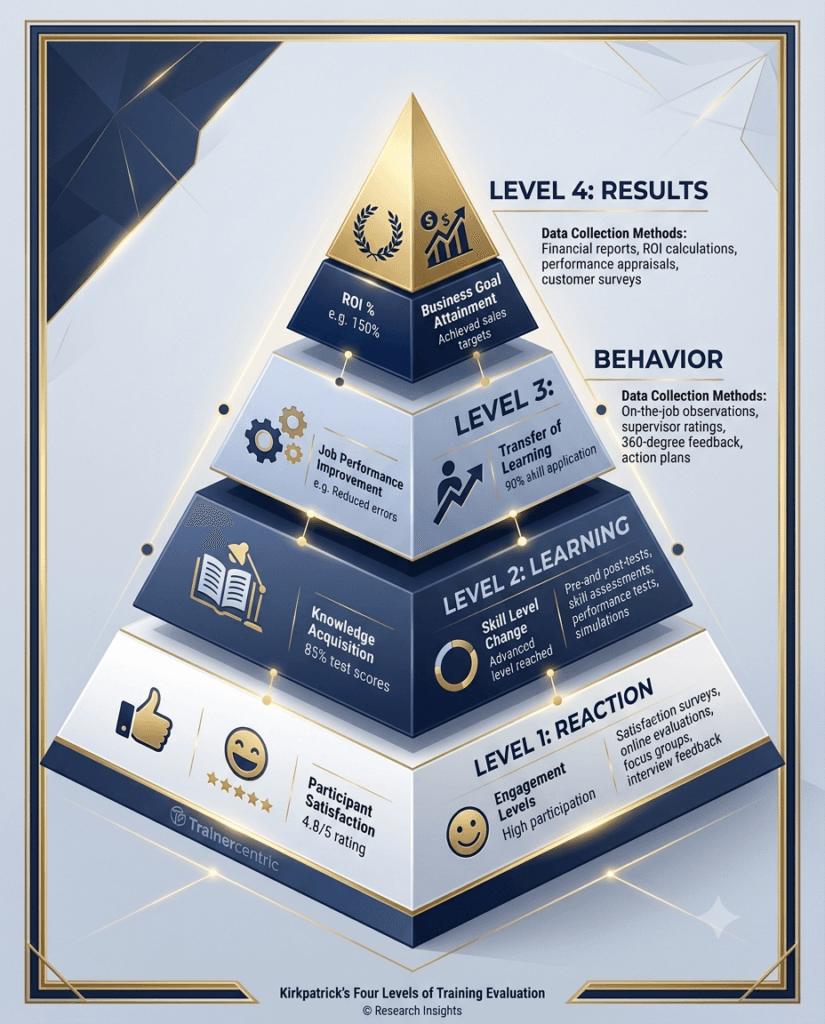
| What is the Kirkpatrick Model? The Kirkpatrick Model is the most widely used framework for measuring training effectiveness. It evaluates training impact across four levels: Reaction (did learners value it?), Learning (did they acquire knowledge?), Behaviour (did they apply it at work?), and Results (did it improve business performance?). |
What is training effectiveness?
Training effectiveness is the extent to which a training programme improves employee knowledge, skills, workplace behaviour, and business outcomes. Effective training produces measurable performance improvements — not just attendance records or completion rates.
The Four Kirkpatrick Levels at a Glance
| Level | Name | Key Question | Typical Timing |
| Level 1 | Reaction | Did learners find the training valuable? | Immediately after training |
| Level 2 | Learning | Did they actually acquire knowledge or skills? | During or immediately after training |
| Level 3 | Behaviour | Did they apply what they learned on the job? | 30–90 days post-training |
| Level 4 | Results | Did it improve business performance? | 60–180 days post-training |
Introduction
The Question Every L&D Professional Must Answer
Your organisation just completed a three-day leadership development programme. Forty-two managers attended. The logistics ran smoothly, the facilitator received positive feedback, and everyone walked out with a certificate of completion.
Six months later, a senior leader asks a single question: “Did it actually work?”
If your answer relies on attendance records and post-training smiles, you are not alone — but you are also not measuring training effectiveness. You are measuring activity.
Organisations across India and globally invest crores of rupees in training programmes every year, yet many struggle to demonstrate whether that investment produced any measurable change in knowledge, behaviour, or business performance.
This guide gives you the frameworks, language, and practical tools to move from measuring completion to measuring impact. Here is what is covered:
- What training effectiveness means — and what it does not
- 25 training effectiveness metrics every L&D team should track
- How to calculate training effectiveness using proven formulas
- How to apply each Kirkpatrick level with practical tools and examples
- Metrics by training type: Sales, Leadership, Compliance, Safety, and more
- A step-by-step implementation roadmap, dashboard, and ready-to-use measurement template
Understanding Training Effectiveness
Training effectiveness is about outcomes, not outputs. Most organisations measure activity — hours delivered, completions logged, surveys collected. Effective L&D teams measure whether learning occurred, whether it transferred to the job, and whether it moved a business needle.
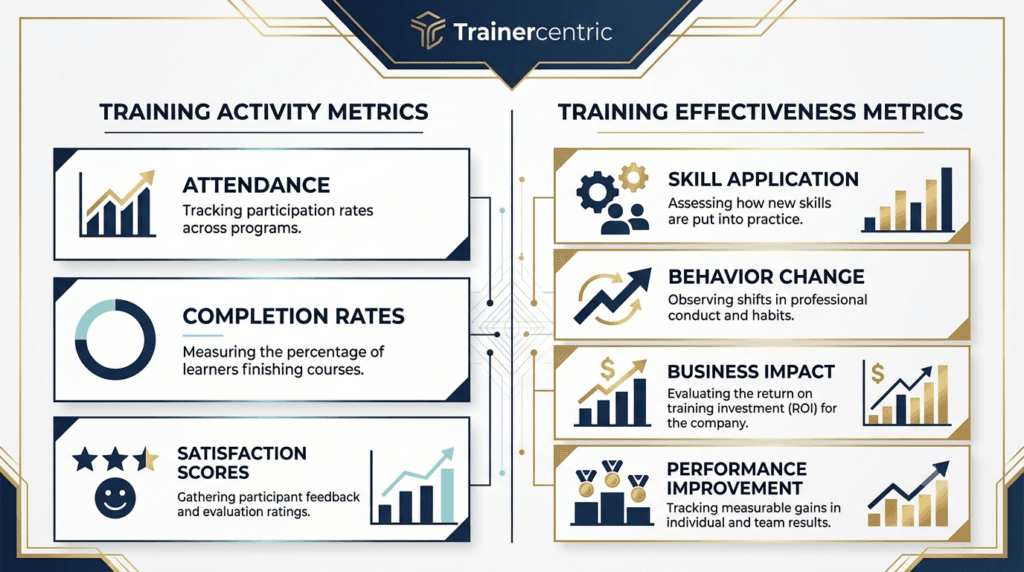
Outputs vs Outcomes: A Critical Distinction
| Output (Activity) | Outcome (Effectiveness) |
| 200 employees completed compliance training | 94% of employees correctly apply data handling protocols |
| 40 managers attended a leadership programme | Manager engagement scores improved by 12 points |
| 3,000 eLearning modules were completed | Customer complaint resolution time dropped by 18% |
| Facilitator delivered training on time and on budget | Salespeople increased cross-sell conversion by 9% |
Many organisations celebrate outputs — hours of training delivered, completion rates, number of sessions conducted. These are useful for administrative tracking, but they say nothing about whether learning occurred or behavior changed.
Why Attendance Is Not Effectiveness
A salesperson can sit through a two-day negotiation skills workshop and retain very little. An employee can click through an eLearning module in 12 minutes without reading a single screen. A manager can attend a coaching programme and return to exactly the same leadership behaviours on Monday morning.
Attendance tells you who was in the room. It does not tell you what they learned, whether they could apply it, or whether the training made any difference to the business.
Why Completion Rates Are Not Effectiveness
Completion rates became a popular metric with the rise of LMS-tracked eLearning. They measure whether someone finished a course — not whether they understood it, retained it, or used it.
Tracking completions without measuring learning is like tracking how many books employees checked out from a library and assuming everyone read them, understood them, and applied the ideas.
The Practical Definition That Matters
For practical purposes, training is effective when:
- Learners acquire the targeted knowledge or skills
- They apply that knowledge or skill in the workplace
- That application produces a measurable improvement in performance or business results
This is the chain of impact that the Kirkpatrick Model helps you trace — level by level.
Why Measuring Training Effectiveness Matters
1. Accountability for Learning Investment
Learning and development is a business function funded by the organisation. Like any other business function, it is subject to scrutiny about return on investment. When L&D teams cannot demonstrate impact, they are vulnerable to budget cuts, reduced headcount, and loss of strategic credibility. Measurement is how you defend and grow your function.
2. Business Alignment
Training that does not connect to a business problem is training for training’s sake. Measurement forces the discipline of connecting learning objectives to performance objectives — which means L&D becomes a strategic partner rather than a service provider.
A robust Training Needs Analysis (TNA) process is where this alignment begins. Evaluation is where you verify whether the alignment was successful.
3. Resource Allocation
Most L&D teams operate with constrained resources. When you measure effectiveness, you discover which programmes are delivering value and which are not. This allows you to reinvest budget and time into what works, eliminate or redesign what does not, and make evidence-based decisions about future learning priorities.
4. Continuous Improvement
Without measurement data, programme improvement is guesswork. With it, you can identify specific gaps — whether at the knowledge level, the behavioral application level, or the environmental support level — and make targeted improvements. Every training effectiveness metric you collect becomes an input to your next design cycle.
5. Executive Buy-In
Senior leaders speak the language of business outcomes. When an L&D function presents data showing that a safety training programme reduced workplace incidents by 23%, or that a sales skills programme contributed to a 15% increase in conversion, leadership pays attention. Measurement is the bridge between L&D credibility and strategic influence.
The Cost of Poor Measurement
Consider this scenario: an organisation invests ₹25 lakhs in a large-scale customer service training programme. Post-training surveys show high satisfaction. But three months later, customer complaint volumes are unchanged and Net Promoter Scores show no improvement.
Without a structured evaluation approach, the L&D team has no way to know:
- Whether learning actually occurred
- Whether participants tried to apply the new behaviors
- Whether the work environment supported those behaviors
- Whether the training was the right intervention at all
The money is spent. The opportunity is lost. And next year, the same programme runs again — because no one had the data to question it.
Training Effectiveness Metrics: 25 KPIs Every L&D Team Should Track
| What are training effectiveness metrics? Training effectiveness metrics are quantitative and qualitative indicators that measure whether a training programme produced the intended change in learner knowledge, workplace behaviour, and business outcomes. They span four categories: reaction, learning, behaviour transfer, and business results. |
Before applying the Kirkpatrick Model, you need to know what you are measuring. These 25 training KPIs cover every level of evaluation — from immediate learner reaction to long-term strategic impact.
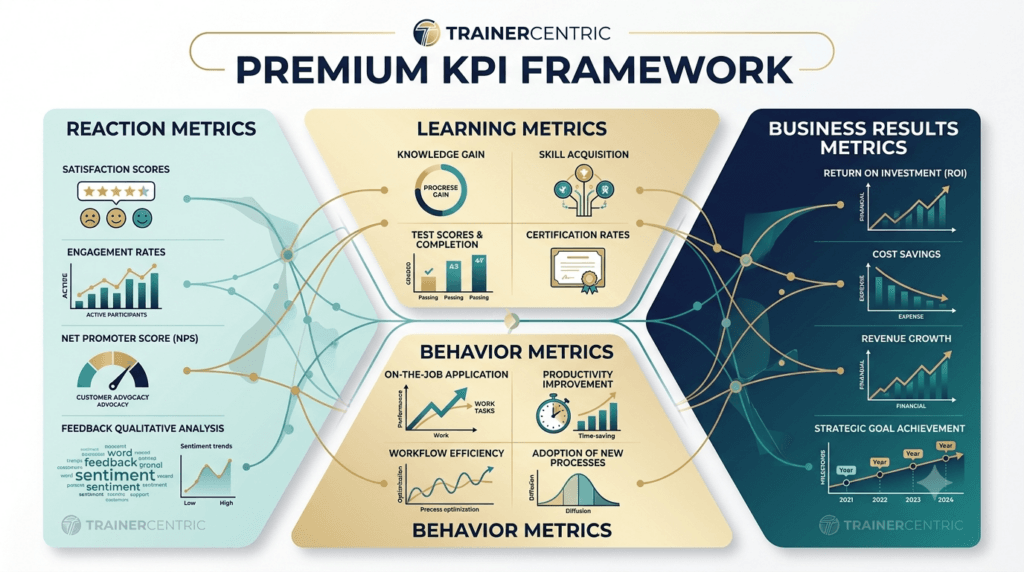
Category 1 — Reaction Metrics
| Metric | What It Measures | Target Benchmark |
| Overall Satisfaction Score | Learner sentiment about the training experience | ≥ 4.0 / 5.0 |
| Content Relevance Score | Perceived job-relevance of content | ≥ 4.2 / 5.0 |
| Net Promoter Score (NPS) | Likelihood to recommend the programme | ≥ +30 |
| Confidence to Apply | Learner’s self-assessed readiness to use skills | ≥ 60% rating ‘highly confident’ |
| Facilitator Effectiveness Rating | Quality of delivery and facilitation | ≥ 4.2 / 5.0 |
Category 2 — Learning Metrics
| Metric | What It Measures | Target Benchmark |
| Knowledge Gain % | Increase from pre- to post-test score | ≥ 20 percentage points |
| Post-Assessment Score | Absolute knowledge level after training | ≥ 80% pass threshold |
| Certification / Exam Pass Rate | Percentage meeting the required standard | ≥ 90% for compliance |
| Skill Demonstration Score | Observed performance in role-play / simulation | ≥ 75% rated ‘Proficient’ |
| Assessment Completion Rate | Percentage who completed the evaluation instrument | ≥ 95% |
Category 3 — Behaviour Transfer Metrics
| Metric | What It Measures | Target Benchmark |
| Manager Observation Score | Manager-rated on-job application of skills | ≥ 70% of behaviours observed consistently |
| Skill Application Frequency | How often learners report using new skills | ≥ 75% applying skills weekly at 60 days |
| Behaviour Adoption Rate | % of trained behaviours consistently applied | ≥ 65% at 60 days post-training |
| Learning Transfer Rate | % of trained content applied on the job | Organisation-defined; track trend over time |
| 360-Degree Feedback Delta | Change in stakeholder ratings pre vs post | Positive delta across ≥ 3 rated competencies |
Category 4 — Business Results Metrics
| Metric | What It Measures | Target Benchmark |
| Productivity Index | Output per employee before and after training | Defined by role and function |
| Revenue per Employee / Team | Business revenue linked to trained cohort | Compared to pre-training baseline |
| Error / Defect Rate | Reduction in process or quality errors | Target % reduction vs baseline |
| Customer Satisfaction (CSAT) | Customer experience scores in trained teams | Improvement vs baseline |
| Time to Competency | How quickly new hires reach full performance | Reduction in days vs cohort benchmark |
Category 5 — Strategic Learning Metrics
| Metric | What It Measures | Target Benchmark |
| Internal Promotion Rate | % of trained employees progressing within org | Compared to untrained cohort |
| Voluntary Turnover Rate (Trained) | Retention of employees in development programmes | Below organisation average |
| Training ROI % | Financial return vs investment cost | Target varies; industry benchmark: 150–300% |
| Manager Satisfaction with L&D | Business stakeholder confidence in training quality | ≥ 4.0 / 5.0 |
| Learning Programme Utilisation | % of eligible employees completing priority programmes | Organisation-defined target |
| TrainerCentric Tip Not every programme needs all 25 metrics. Prioritise metrics based on what decisions you need to make. A compliance programme needs Category 2 and 4 metrics most. A leadership development programme needs Categories 3 and 5 most. |
How to Calculate Training Effectiveness: Formulas and Methods
How do you calculate training effectiveness? Training effectiveness is calculated by comparing pre-training and post-training performance data against a defined target. Three key formulas are used: the Learning Gain formula (knowledge improvement), the Training Effectiveness Index (performance gap closure), and the Phillips ROI formula (financial return on training investment).
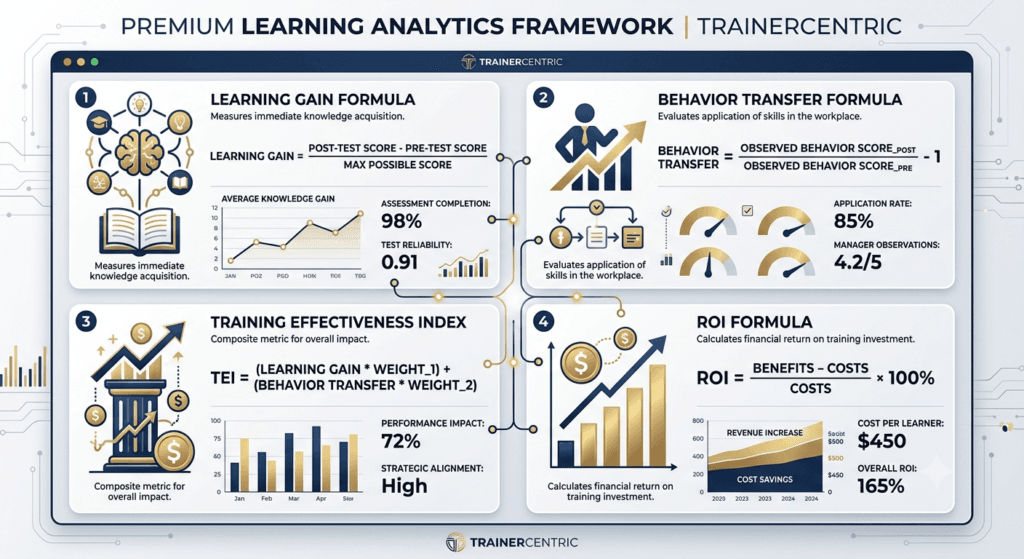
Formula 1: Learning Gain (%)
| Learning Gain Formula Learning Gain (%) = (Post-Test Score − Pre-Test Score) ÷ Pre-Test Score × 100 Example: Pre-test score = 52%. Post-test score = 78%. Learning Gain = (78 − 52) ÷ 52 × 100 = 50% gain in knowledge |
Use this formula to evaluate every knowledge-based training programme. A learning gain below 15% suggests the programme added limited new knowledge (either content was too easy, already known, or not retained).
Formula 2: Training Effectiveness Index (%)
Training Effectiveness (%) = (Post-Training Performance − Pre-Training Performance) ÷ (Target Performance − Pre-Training Performance) × 100
Example: Pre-training sales conversion = 18%. Post-training = 24%. Target = 30%. Training Effectiveness = (24 − 18) ÷ (30 − 18) × 100 = 50% progress toward target
This formula is particularly useful for reporting to business stakeholders because it shows progress toward a defined performance goal — not just raw improvement. It frames training in the language of gap closure rather than test scores.
Formula 3: Training ROI (%)
| Training ROI Formula (Phillips Model) ROI (%) = [(Total Monetary Benefits − Total Training Cost) ÷ Total Training Cost] × 100 Example: Training cost = ₹8 lakhs. Quantified benefit (reduced errors, improved productivity) = ₹20 lakhs. ROI = [(20 − 8) ÷ 8] × 100 = 150% ROI |
ROI calculation requires isolating training’s contribution from other variables, converting performance improvements into monetary terms, and calculating fully-loaded programme costs. For most programmes, Levels 1–3 data is sufficient. Reserve ROI calculation for major high-investment initiatives requiring C-suite justification.
Formula 4: Behaviour Transfer Rate (%)
Behaviour Transfer Rate (%) = (Number of trained behaviours consistently observed) ÷ (Total trained behaviours assessed) × 100
Example: 6 of 8 behaviours from a coaching skills programme observed consistently at 60 days. Behaviour Transfer Rate = 6 ÷ 8 × 100 = 75%
Track this at 30 days and again at 60–90 days. A transfer rate that improves between 30 and 60 days indicates positive reinforcement in the work environment. A rate that declines suggests environmental barriers are overriding trained behaviours.
What Is the Kirkpatrick Model?
Dr. Donald Kirkpatrick first published his four-level framework in 1959, formalising it in his 1994 book Evaluating Training Programs: The Four Levels. In 2016, James Kirkpatrick and Wendy Kirkpatrick updated the model with the New World Kirkpatrick Model, which emphasises designing evaluation backwards from business results rather than forward from training delivery.
After more than six decades, the model endures because of its intuitive logic, flexibility across formats and industries, and the shared language it gives L&D and business stakeholders for discussing training effectiveness measurement.
Why It Has Endured for Six Decades
The model’s staying power comes from four qualities: its intuitive cascade logic (each level enables the next), flexibility across delivery formats and industries, universal applicability regardless of training type, and the shared vocabulary it creates between L&D and business stakeholders. Whether you are evaluating classroom training, eLearning, blended programmes, or on-the-job coaching, the four-level structure applies.
Level 1: Reaction — Did Learners Find It Valuable?
| What is Level 1 of the Kirkpatrick Model? Level 1 (Reaction) measures whether participants found the training valuable, relevant to their job, and engaging. It is assessed through post-training surveys that capture satisfaction scores, content relevance ratings, and confidence to apply learning. It is the easiest level to measure but the weakest predictor of training effectiveness. |
What It Measures
Level 1 captures the participant’s immediate subjective experience of the training, including their satisfaction with content, delivery, facilitator, logistics, and perceived relevance to their job. Kirkpatrick distinguished between two types of reaction:
- Satisfaction — how much learners enjoyed or liked the training
- Relevance — how applicable they felt the training was to their actual work
The updated New World Kirkpatrick Model adds a third type: Engagement — how actively learners participated and how motivated they were to apply what they learned.
Typical Metrics
- Overall training satisfaction score (1–5 or 1–10 scale)
- Facilitator effectiveness rating
- Content relevance rating
- Course material quality rating
- Net Promoter Score (NPS)
- Perceived confidence to apply learning
Sample Post-Training Survey Questions
Use these as a starting point and adapt them to your context:
- Overall, how satisfied are you with this training programme? (1–5 scale)
- How relevant was the content to your current job responsibilities? (1–5 scale)
- How effective was the facilitator at explaining concepts clearly? (1–5 scale)
- Did the training include sufficient practical application and examples? (1–5 scale)
- How well was the training paced? (1–5 scale)
- Were the training materials (slides, handouts, tools) useful? (1–5 scale)
- How confident do you feel in applying what you learned to your work? (1–5 scale)
- How likely are you to recommend this programme to a colleague? (0–10 NPS scale)
- What was the most valuable aspect of this training for you? (open text)
- What one change would most improve this programme? (open text)
- What support would help you apply what you learned on the job? (open text)
- Did the training meet your expectations coming in? (Yes / Partially / No)
Limitations: Why ‘Happy Sheets’ Are Not Enough
Level 1 data has significant limitations that every L&D professional must understand:
- Satisfaction does not equal learning. Research consistently shows a weak correlation between learner satisfaction scores and actual knowledge gains.
- Relevance ratings are self-assessed. Participants’ perception of relevance may not match actual job requirements.
- Immediate feedback reflects immediate experience. Participants often rate training higher immediately after delivery and more critically when they return to work.
- Social desirability bias. Particularly in face-to-face settings, participants may rate training higher out of politeness.
Level 1 data should inform programme design and delivery — but it should never be used as a proxy for training effectiveness.
Level 2: Learning — Did They Actually Learn?
| What is Level 2 of the Kirkpatrick Model? Level 2 (Learning) evaluates whether participants acquired the knowledge, skills, or attitude changes the training intended to develop. It is measured through pre- and post-assessments, skill demonstrations, and scenario-based evaluations. A pre/post design is essential — without a baseline, you cannot prove learning occurred as a result of the training. |
What It Measures
Level 2 evaluates whether participants actually acquired the knowledge, skills, and attitudes the training intended to develop. The New World Kirkpatrick Model identifies three components:
- Knowledge — what they now know (factual, conceptual, procedural)
- Skill — what they can now do (demonstrated competence)
- Attitude — how they now feel or think about the topic (mindset shifts)
This level connects directly to your Learning Objectives. If objectives are well-written and measurable — aligned with Bloom’s Taxonomy and grounded in Adult Learning Theory — Level 2 measurement becomes straightforward. Strong instructional design using frameworks like ADDIE builds assessment into the design phase before content is ever created.
Methods for Measuring Learning
| Method | Best Used For | Strengths | Limitations |
| Multiple choice assessment | Knowledge (facts, concepts, procedures) | Easy to administer, auto-scored | Can be gamed, doesn’t test application |
| Scenario-based questions | Applied knowledge | Tests judgment and decision-making | Harder to design well |
| Skill demonstration / role-play | Behavioural skills | High validity | Resource-intensive to assess |
| Simulation | Technical or complex skills | Safe practice environment | Expensive to build |
| Certification exam | Technical / compliance knowledge | Standardised benchmark | High stakes, may not reflect real performance |
| Reflective writing | Attitude and sense-making | Rich qualitative data | Hard to score reliably |
The Pre/Post Design: A Critical Best Practice
Never rely solely on a post-training assessment. Without a baseline, you cannot demonstrate that learning occurred as a result of the training — the participant may have already known the material.
Use a pre/post design:
- Administer the assessment before training (pre-test)
- Administer the same or equivalent assessment after training (post-test)
- Calculate the learning gain using Formula 1 (see the calculation section above)
This approach also helps you identify participants who may not need the training (high pre-test scores) and those who need additional support (low post-test scores despite the training).
Example Evaluation Plan: Compliance Training
| Evaluation Element | Design |
| Pre-test | 20-question knowledge assessment before training begins |
| Learning objective | 90% of participants will score ≥ 80% on the post-assessment |
| Post-test | Same 20-question assessment, delivered within 1 hour of training completion |
| Results | Pre-test mean: 54%. Post-test mean: 88%. 91% of participants met the ≥ 80% threshold |
| Action | The 27 participants who scored below 80% completed a targeted remediation module |
Level 3: Behaviour — Did They Apply It on the Job?
| What is Level 3 of the Kirkpatrick Model? Level 3 (Behaviour) evaluates whether participants changed their on-the-job behaviour as a result of training. It is the critical bridge between the learning environment and real-world performance, measured through manager observation, 360-degree feedback, self-assessments, and performance audits at 30, 60, and 90 days post-training. |
Why This Level Is Most Often Ignored
Despite being the most crucial level, Level 3 is the least frequently measured. The reasons are structural:
- It requires time — behaviour change is typically assessed 30–90 days after training
- It requires manager involvement — and managers are often not briefed, trained, or incentivised to support learning transfer
- It requires a data system — connecting training records to performance data is a technical and organisational challenge
- It exposes uncomfortable truths — when behaviour has not changed, the organisation must confront why
The absence of Level 3 measurement is one reason training often fails to change business outcomes — not because it cannot, but because the systems to support and measure learning transfer simply do not exist.
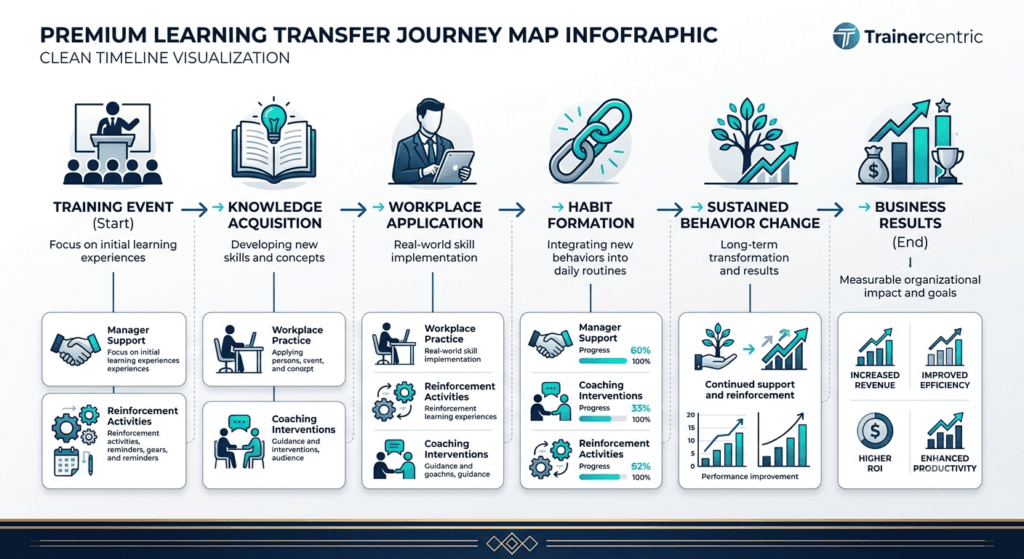
| What is learning transfer in training? Learning transfer is the degree to which knowledge and skills acquired in training are applied effectively and consistently in the workplace. It is influenced by learner motivation, manager support, opportunities to practise, and the work environment. Learning transfer is what turns training spend into business performance — and it is what Level 3 of the Kirkpatrick Model measures. |
Measurement Methods
- Manager observation checklists — structured tools that managers use to observe and rate specific behaviours on the job
- 360-degree feedback — input from peers, direct reports, and managers on behaviour change
- Performance review data — if the behavioural objective is captured in the performance management system
- Self-assessment surveys — participants rate their own frequency of applying specific behaviours
- On-the-job audits — for process-based roles, audits of actual work output (call recordings, quality checks)
- Mystery shopper / customer feedback — particularly for customer-facing roles
Sample Behaviour Indicators by Training Type
Sales Training:
- Uses needs-discovery questions before proposing solutions (observed in calls/meetings)
- Follows the agreed proposal structure in written pitches
- Handles price objections using the trained framework
Customer Service Training:
- Greets customers using the service script within the first 10 seconds of a call
- Uses empathy statements before moving to problem resolution
- Offers alternative solutions when first resolution is unavailable
Leadership Training:
- Holds structured one-on-one conversations with direct reports weekly
- Provides specific behavioural feedback rather than general praise
- Involves team members in decision-making using facilitated discussion
Challenges and Solutions
| Challenge | Solution |
| Managers don’t observe or report | Brief managers before training; create a simple observation tool; make observation a shared accountability |
| Participants revert to old habits | Design spaced reinforcement (nudges, reminders, practice tasks) into the post-training period |
| No baseline behaviour data | Conduct pre-training observation or 360-feedback before training begins |
| Attribution is unclear | Use a control group (if possible) or compare behaviour data against defined baseline |
| Surveys are self-reported and biased | Triangulate self-report with manager observation and performance data |
Level 4: Results — Did Business Performance Improve?
| What is Level 4 of the Kirkpatrick Model? Level 4 (Results) measures whether training produced a measurable improvement in the business outcomes it was designed to influence — such as revenue, productivity, quality, safety, or customer satisfaction. It requires pre-training baselines, appropriate time for behavioural change to translate into results, and transparent handling of confounding variables. |
Business Metrics by Training Category
| Training Type | Relevant Business Metrics |
| Sales Training | Revenue per salesperson, conversion rate, average deal size, sales cycle length |
| Customer Service Training | Customer Satisfaction Score (CSAT), NPS, first-contact resolution rate, complaint volume |
| Leadership Training | Employee engagement scores, team turnover rate, internal promotion rate, 360-feedback scores |
| Compliance Training | Audit findings, regulatory violations, incident rate, policy adherence |
| Safety Training | Lost-time injury rate, near-miss reporting, safety audit scores |
| Operations Training | Error rate, process cycle time, rework rate, quality scores |
| Onboarding | Time-to-productivity, 90-day retention, new hire performance ratings |
How to Connect Training to Business Outcomes
The connection between training and business results is rarely direct. Multiple variables influence any business metric. The L&D professional’s job is not to claim exclusive credit — it is to demonstrate a plausible, evidence-based contribution.
- Identify the business metric before training begins. Define what success looks like in business terms.
- Establish a baseline. Collect pre-training data on the business metric.
- Measure post-training performance at an appropriate interval — typically 60 to 180 days.
- Control for confounding variables. Acknowledge what else changed during the measurement period.
- Isolate the contribution of training using control groups, trend analysis, or expert estimation.
The Attribution Challenge
A common criticism of Level 4 measurement is that it is difficult — sometimes impossible — to conclusively attribute a business outcome to a single training intervention. This is true. But it is not a reason to abandon Level 4 measurement. It is a reason to be epistemically honest.
The standard in corporate L&D is not proof beyond reasonable doubt. It is a credible, evidence-based estimate of contribution — the same standard applied to marketing campaigns, technology implementations, and process improvement initiatives.
Training Effectiveness Metrics and Examples by Training Type
| How do you measure the effectiveness of different types of training? Training effectiveness metrics vary by training type because each programme targets different performance outcomes. Sales training is measured through revenue and conversion data. Leadership training is measured through engagement scores and team performance. Compliance training is measured through audit results and incident rates. Each requires a tailored combination of Level 2, 3, and 4 metrics. |
One of the most common gaps in L&D evaluation practice is applying generic metrics to every programme regardless of its purpose. This section provides a customised measurement framework for six high-priority training types.
Sales Training Effectiveness Metrics
| Kirkpatrick Level | Metric | Data Source | Timing |
| Level 2 | Knowledge gain on sales methodology assessment | Pre/post LMS assessment | Day 1 vs Day 3 |
| Level 2 | Skill demonstration in negotiation role-play | Facilitator rubric | End of programme |
| Level 3 | Use of needs-discovery framework in customer calls | Manager observation / call recording | 30 & 60 days |
| Level 3 | Pitch structure adherence in written proposals | Sales manager review | 60 days |
| Level 4 | Revenue per salesperson vs pre-training baseline | CRM data | 90 days |
| Level 4 | Conversion rate and average deal size | CRM / finance data | 90 days |
Leadership Training Effectiveness Metrics
| Kirkpatrick Level | Metric | Data Source | Timing |
| Level 2 | 360-degree feedback scores (pre vs post) | 360 tool | Before & 90 days after |
| Level 3 | Frequency of structured 1-on-1 meetings held | Manager self-report / calendar audit | 30 & 60 days |
| Level 3 | Quality of feedback given (rated by direct reports) | Pulse survey to team | 60 days |
| Level 4 | Team engagement score change | Annual / pulse engagement survey | 90–180 days |
| Level 4 | Team voluntary turnover rate | HRIS data | 6–12 months |
| Level 4 | Internal promotion rate of trained leaders | HR talent data | 12 months |
Customer Service Training Effectiveness Metrics
| Kirkpatrick Level | Metric | Data Source | Timing |
| Level 2 | Scenario-based assessment score | LMS / facilitator | End of programme |
| Level 3 | Service protocol adherence (call / interaction audit) | QA / mystery shopper | 30 & 60 days |
| Level 3 | Empathy statement usage in customer interactions | Call recording review | 30 & 60 days |
| Level 4 | CSAT score change vs baseline | Customer satisfaction survey | 90 days |
| Level 4 | First-contact resolution rate | CRM / call centre data | 90 days |
| Level 4 | Complaint volume reduction vs prior period | CRM data | 90 days |
Compliance Training Effectiveness Metrics
| Kirkpatrick Level | Metric | Data Source | Timing |
| Level 2 | Post-assessment pass rate (≥ 80% threshold) | LMS assessment | Immediately post-training |
| Level 3 | Policy adherence rate observed on the job | Supervisor audit / spot checks | 30 days |
| Level 4 | Audit findings / regulatory violations vs prior period | Compliance / audit data | 90 days |
| Level 4 | Incident rate change vs baseline | Risk / safety data | 90 days |
Safety Training Effectiveness Metrics
| Kirkpatrick Level | Metric | Data Source | Timing |
| Level 2 | Safety protocol knowledge assessment score | LMS or paper assessment | Immediately post-training |
| Level 3 | Safe behaviour compliance rate (observed) | Safety supervisor audit | 30 days |
| Level 3 | Near-miss reporting rate (indicates a safety culture signal) | Incident reporting system | 30–90 days |
| Level 4 | Lost-time injury rate vs baseline | EHS / safety data | 90–180 days |
| Level 4 | Safety audit score change | External / internal audit | 6 months |
Onboarding Effectiveness Metrics
| Kirkpatrick Level | Metric | Data Source | Timing |
| Level 2 | Product / process knowledge assessment score | LMS assessment | End of onboarding |
| Level 3 | Role-specific task completion rate | Manager observation / checklist | 30 days |
| Level 4 | Time to full productivity vs historical cohort average | Manager rating / performance data | 60–90 days |
| Level 4 | 90-day retention rate | HRIS attrition data | 90 days |
| Level 4 | New hire performance rating (90-day review) | Performance management system | 90 days |
Real-World Case Study: Customer Service Training Programme
The following case study illustrates a complete Kirkpatrick evaluation across all four levels.
Context
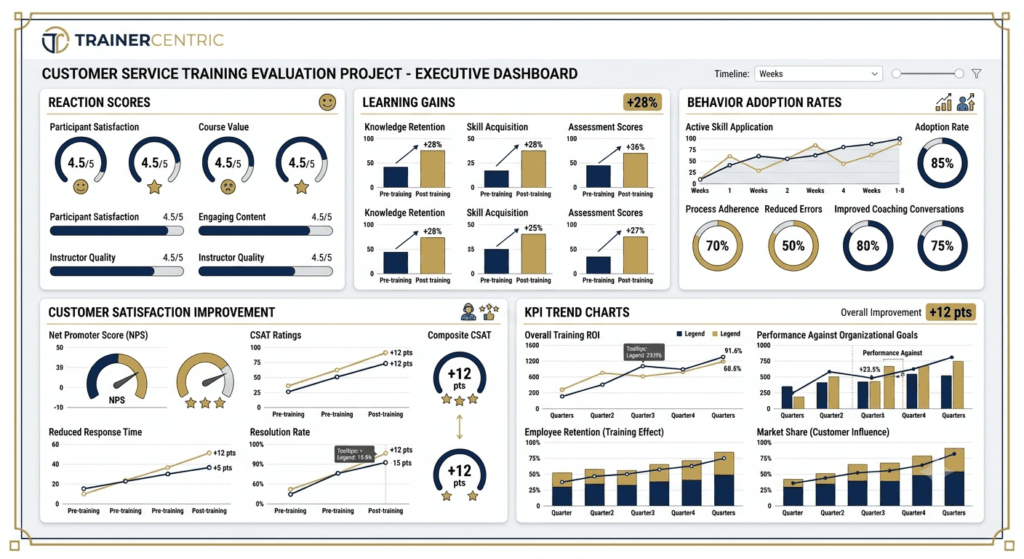
A retail banking organisation in India deployed a three-day customer service excellence programme for 85 branch service staff across 12 branches. The programme covered empathy skills, complaint handling, cross-selling conversations, and service recovery protocols.
Business Problem: Customer satisfaction scores had declined from 79% to 71% over two quarters. Customer complaint volumes had increased by 22%. Leadership wanted measurable improvement within 90 days.
Evaluation Design and Findings
| Kirkpatrick Level | Metric | Data Source | Finding |
| Level 1: Reaction | Overall satisfaction score | Post-training survey (Day 3) | 4.3/5.0 average |
| Level 1: Reaction | Relevance rating | Post-training survey | 4.5/5.0 — highly relevant to my job |
| Level 1: Reaction | Confidence to apply | Post-training survey | 62% highly confident (up from 31%) |
| Level 2: Learning | Knowledge assessment score | Pre-test (Day 1) vs Post-test (Day 3) | Pre: 58% → Post: 84% (26-point gain) |
| Level 2: Learning | Skill demonstration | Role-play observation, Day 3 | 71% demonstrated empathy protocol correctly |
| Level 3: Behaviour | Manager observation checklist | 30 and 60 day structured observations | 67% using protocol at Day 30; 79% at Day 60 |
| Level 3: Behaviour | Call quality audit | Random sample of 10 calls per person | Service protocol: 58% (Day 30) → 74% (Day 60) |
| Level 4: Results | Customer Satisfaction Score | Branch customer surveys | Improved from 71% to 79% over 90 days (+8 points) |
| Level 4: Results | Complaint volume | Branch CRM data | Reduced by 17% vs same quarter prior year |
| Level 4: Results | Cross-sell conversation rate | Observed in 48% of interactions (up from 22%) | Sales referral volume increased 31% |
Key Findings and Actions
The evaluation revealed that behavioural transfer was strongest in branches where managers had been briefed and actively coached staff (average Day 60 protocol compliance: 81% vs 63% in non-coached branches). This insight led the organisation to redesign future programmes to include mandatory manager briefing sessions before training delivery.
Training Effectiveness Dashboard Example
| What should a training effectiveness dashboard include? A training effectiveness dashboard tracks KPIs across all four Kirkpatrick levels in a single view, enabling L&D teams to monitor programme performance, identify transfer gaps, and report impact to stakeholders. It typically includes reaction scores, learning gain percentages, behaviour transfer rates, and business metric changes versus pre-training baselines. |
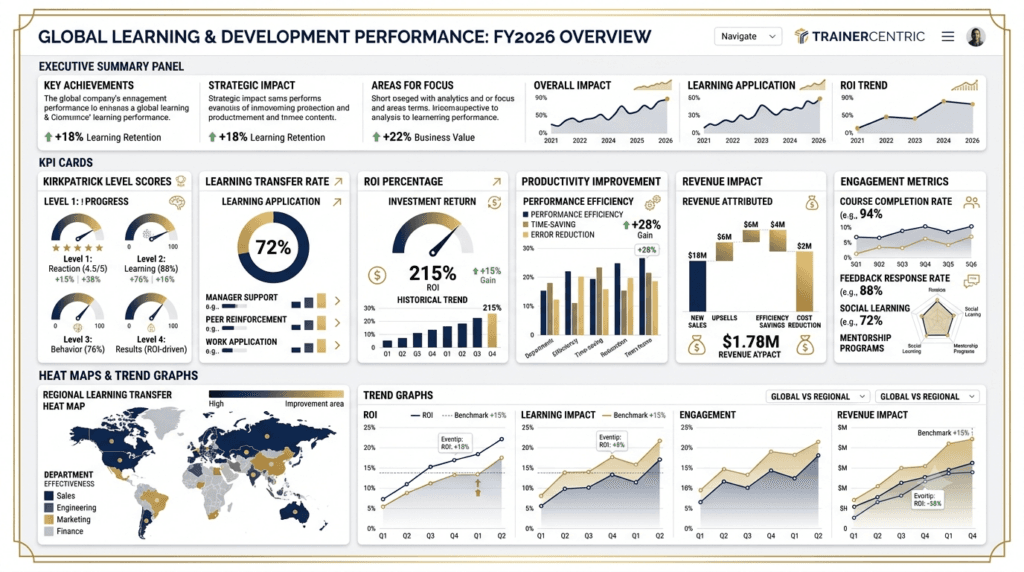
The table below illustrates a monthly training effectiveness dashboard for a multi-programme L&D function. Adapt the metrics to match your programme portfolio.
| Programme | L1: Avg Satisfaction | L2: Learning Gain % | L3: Transfer Rate (60d) | L4: Business Impact | Status |
| Sales Negotiation Skills | 4.4 / 5.0 | +32 pts | 74% | Conversion +9% | ✓ |
| Leadership Essentials | 4.1 / 5.0 | +28 pts | 61% | Engagement +7 pts | ✓ |
| AML Compliance | 3.9 / 5.0 | +41 pts | 88% | Zero audit findings | ✓ |
| Customer Service Excellence | 4.3 / 5.0 | +26 pts | 72% | CSAT +8 pts | ✓ |
| Onboarding — Batch 3 | 4.0 / 5.0 | +19 pts | 44% | Time-to-prod: 34 days (target: 30) | ⚠ |
| Safety Induction | 3.7 / 5.0 | +22 pts | N/A (30d pending) | N/A (measuring) | — |
| How to use this dashboard Green (✓): Programme is tracking as expected. No action required.Amber (⚠): One or more metrics are below target. Review transfer barriers — are managers supporting application?Dash (—): Data collection in progress. No judgement yet.Review this dashboard monthly with L&D stakeholders. Use it to prioritise follow-up conversations with managers of amber programmes. |
Common Mistakes When Using the Kirkpatrick Model
1. Measuring Only Level 1
The most prevalent mistake in corporate L&D. Post-training satisfaction surveys are easy, inexpensive, and politically safe. But measuring only Level 1 gives organisations a false sense of evaluation rigour while providing no useful data about learning or impact.
Fix: Build a minimum two-level evaluation into every programme — at least Levels 1 and 2 for every intervention, and Level 3 for any significant behaviour-change programme.
2. Ignoring Behaviour Change Entirely
Many organisations measure knowledge (Level 2) and business outcomes (Level 4) while skipping Level 3 — the very level that connects them. Without Level 3 data, you cannot diagnose why business results do or do not improve. A strong Training Needs Analysis identifies what behaviour change is expected; Level 3 measurement verifies whether it happened.
Fix: Design Level 3 measurement into every programme that aims to change workplace behaviour, and involve managers as active partners in supporting and measuring learning transfer.
3. Collecting Data Without Acting On It
Conducting rigorous evaluation and identifying clear gaps — and then filing the report without changing anything — is perhaps the most wasteful mistake. Data collected for compliance or political purposes, with no genuine intent to improve, undermines the entire evaluation function.
Fix: Every evaluation should produce at least one specific recommendation. Build an action planning session into your evaluation process.
4. Lack of Baseline Data
If you do not know where performance was before training, you cannot demonstrate improvement. Yet many organisations launch training, collect post-training data, and have no pre-training comparison point.
Fix: Establish baselines before training begins — both learning baselines (pre-tests) and business baselines (current performance metrics on the intended outcome). Connect this to your Training Needs Analysis process.
5. Poor Survey and Assessment Design
Level 1 surveys that ask only about logistics and facilitator quality, or Level 2 assessments that test memorisation rather than application, produce misleading data.
Fix: Design evaluation instruments using the same rigour you apply to learning design. Align every evaluation question to a specific decision you need to make. Writing strong Learning Objectives first makes assessment design substantially easier.
6. Confusing Correlation with Causation
Business metrics improved after training. Therefore, training caused the improvement. This logic is seductive and frequently wrong. Markets shift, products change, new managers arrive — all of these affect business metrics independently of training.
Fix: Always document confounding variables. Use control groups where possible. Frame your Level 4 findings as estimated contribution rather than proven cause. This epistemic honesty is more credible, not less.
Kirkpatrick Model vs Training ROI: Which Should You Use?
| Dimension | Kirkpatrick Model | Training ROI (Phillips Model) |
| Purpose | Evaluate training effectiveness across four dimensions | Calculate financial return on training investment |
| Output | Structured evidence of learning and impact | A percentage return: (Net Benefit ÷ Cost) × 100 |
| Complexity | Moderate | High — requires financial conversion of business benefits |
| Audience | L&D, HR, Managers | CFO, Board, Senior Leadership |
| Frequency of use | All programmes | High-investment or high-stakes programmes only |
| Best used for | Programme improvement and evaluation | Strategic investment justification |
The two approaches complement each other. The Kirkpatrick Model provides the evaluation framework that gathers the data. The Phillips ROI Model provides a financial methodology for converting Level 4 results into a return on investment percentage.
When to use ROI: for programmes with significant budget investment (typically ₹10 lakhs+), for C-suite or board-level reporting, or when a business case must be made for a major learning initiative.
When Kirkpatrick alone suffices: for most programme evaluation, operational reporting, continuous improvement, and manager-level accountability.
Beyond the Kirkpatrick Model: Training Evaluation Framework Comparison
| What are the main training evaluation frameworks? The four main training evaluation frameworks are the Kirkpatrick Model (four levels: reaction to results), the Phillips ROI Model (adds financial return calculation), Brinkerhoff’s Success Case Method (focuses on extreme cases of transfer success and failure), and Learning Analytics (uses data systems to build predictive models of training impact). |
The Kirkpatrick Model is not the only evaluation framework available. Understanding where each fits helps you choose the right approach for each programme.
Evaluation Framework Comparison
| Framework | Best For | Difficulty | When to Use |
| Kirkpatrick Model | Most training programmes | Medium | Default evaluation framework for all programmes |
| Phillips ROI Model | Executive reporting and high-investment programmes | High | When C-suite needs financial justification (₹10 lakhs+) |
| Brinkerhoff’s Success Case Method | Leadership and coaching programmes | Medium | When you need to understand why transfer succeeds or fails |
| Learning Analytics (xAPI) | Mature L&D organisations with data infrastructure | High | When you need predictive insight and automated measurement at scale |
The Phillips ROI Model (Level 5)
| What is the Phillips ROI Model? The Phillips ROI Model extends Kirkpatrick by adding a fifth level: financial return on investment. It provides a 10-step process for calculating training ROI, including methods for isolating training’s contribution from other business variables and converting performance improvements into monetary values. Most organisations apply it selectively to high-investment programmes. |
Brinkerhoff’s Success Case Method
Robert Brinkerhoff’s approach focuses on identifying extreme cases — the most and least successful applications of training — rather than averaging across all participants. By deeply studying what worked for high-success cases and what went wrong for low-success cases, organisations gain rich, actionable insight into what factors drive learning transfer and what barriers prevent it. This is particularly useful for leadership development and coaching programmes.
Learning Analytics
With the growth of Learning Management Systems (LMS), Learning Experience Platforms (LXP), and integrated HCM systems, organisations now have access to learner behavioural data at a level of granularity that was impossible a decade ago. Learning analytics combines xAPI tracking, performance data, engagement data, and business metrics to build predictive models of training impact.
When to move beyond Kirkpatrick: when your organisation has mature evaluation processes, significant data infrastructure, and a need for predictive — rather than retrospective — insight into learning impact.
Step-by-Step Guide to Implementing Kirkpatrick in Your Organisation
Step 1: Define the Business Goal
Start with the business problem, not the training solution. What outcome does the organisation need to achieve? Connect this to a proper Training Needs Analysis to confirm that training is the right solution, and to a Job Task Analysis to identify the specific behaviours and knowledge gaps driving the performance problem. If training is the right answer, your evaluation plan should be designed in parallel with — not after — the instructional design process. Frameworks like ADDIE build evaluation planning into the Analysis and Design phases from the start.
Step 2: Define Success Metrics at Each Level
Working backwards from the business goal, define what success looks like at each Kirkpatrick level:
- Level 4: What business metric will improve? By how much? By when?
- Level 3: What specific behaviours must change to produce that result?
- Level 2: What knowledge, skills, or attitudes must be acquired? How will you assess them using the learning gain formula?
- Level 1: What level of participant satisfaction and relevance would indicate a well-designed programme?
Step 3: Establish Baseline Data
Before training begins, collect current business metric performance (Level 4 baseline), current behavioural observation data if possible (Level 3 baseline), and pre-training knowledge assessment scores (Level 2 baseline). Without baselines, you can describe where you ended up — but not how far you travelled.
Step 4: Design the Evaluation Plan
Create a written evaluation plan specifying what will be measured at each level, what instruments will be used, who is responsible for data collection, when data will be collected, and how data will be analysed and reported.
Step 5: Collect Data
Execute the evaluation plan consistently. Mitigate common failure points by keeping survey instruments short, briefing managers in advance, and establishing data-sharing agreements with HR and business operations before training begins.
Step 6: Analyse Findings and Draw Conclusions
Compare post-training data against baseline data. Identify where learning occurred and where it did not, where behavioural transfer occurred and where it did not, what business metrics changed, and what factors explain the results. Be honest about what the data does and does not show.
Step 7: Report Findings and Drive Improvement
Present findings to relevant stakeholders. Focus not just on what happened, but on what it means and what you recommend: which programme elements to maintain, what should be redesigned, what environmental or management factors need to change to support transfer. Close the loop by documenting improvements and evaluating whether they produce better results in the next programme cycle.
Training Effectiveness Measurement Template
Use this template to plan your evaluation before training design begins.
Blank Template
| Evaluation Level | Success Metric | Data Source | Timing | Collection Method | Owner |
| Level 1: Reaction | |||||
| Level 2: Learning | |||||
| Level 3: Behaviour | |||||
| Level 4: Results |
Completed Example: Sales Negotiation Skills Programme
| Evaluation Level | Success Metric | Data Source | Timing | Collection Method | Owner |
| Level 1: Reaction | Satisfaction ≥ 4.0/5.0; Relevance ≥ 4.2/5.0; Confidence to apply ≥ 60% | Post-training survey | Immediately post-training | Online survey (SurveyMonkey / LMS) | L&D Coordinator |
| Level 2: Learning | Post-test score ≥ 80%; Minimum 15-point gain over pre-test | LMS assessment | Day 1 morning (pre) & Day 2 end (post) | 25-question scenario-based assessment | L&D Designer |
| Level 2: Learning | 75% demonstrate negotiation framework correctly in role-play | Facilitator observation | Day 2 afternoon | Structured rubric (5 behaviours, 1–4 scale) | Facilitator |
| Level 3: Behaviour | ≥ 70% applying value-first negotiation (rated by manager) | Manager observation checklist | 30 & 60 days post-training | Emailed checklist (8 behavioural indicators) | Sales Managers |
| Level 4: Results | Average deal margin improves from 18.3% to 21% within 90 days | CRM and finance data | 90 days post-training | CRM extract vs pre-training baseline | L&D + Sales Ops |
| Training Effectiveness Measurement Toolkit Download the complete TrainerCentric toolkit — everything you need to implement Kirkpatrick from Day 1: Kirkpatrick Evaluation Plan Template (fillable), 25-KPI Training Effectiveness Scorecard, Level 3 Manager Observation Checklist, Training Effectiveness Dashboard (editable)Learning Transfer Planner, ROI Calculator |

Frequently Asked Questions
Is the Kirkpatrick Model still relevant today?
Yes — the Kirkpatrick Model remains the most widely used training evaluation framework globally. Its core logic (reaction → learning → behaviour → results) reflects a universal chain of training impact that applies regardless of delivery format or technology. Updated versions like the New World Kirkpatrick Model address contemporary L&D challenges including business partnership and learning transfer.
What is the most important Kirkpatrick level?
Level 3: Behaviour. It is the level most directly within L&D’s influence and the one most directly connected to business impact. High Level 2 scores mean nothing if learning is never transferred to the job. When organisations invest in supporting and measuring Level 3, both learning impact and business results improve.
Do you have to measure all four levels for every programme?
No. Apply measurement rigorously in proportion to the programme’s cost, strategic importance, and intended impact. For short, low-cost informational programmes, Levels 1 and 2 may suffice. For major leadership, sales, or culture change programmes, all four levels should be measured.
How long should evaluation continue after training?
It depends on the change you are measuring. Level 1 is immediate. Level 2 is immediate to 48 hours. Level 3 should be measured at 30 days and again at 60–90 days. Level 4 should be measured at 60–180 days, depending on how quickly the targeted business metric responds to behavioural change.
Can eLearning programmes be evaluated using the Kirkpatrick Model?
Yes. The model applies to all learning formats. For eLearning: Level 1 via post-module surveys; Level 2 via embedded knowledge checks and scenario-based assessments; Level 3 via manager observation or LMS-tracked performance tasks; Level 4 via business data connected to the learning system.
How do you measure leadership training effectiveness?
Leadership training is among the most challenging to evaluate because its impact is indirect — leaders influence team performance rather than business metrics directly. Recommended approach: Level 2 via 360-degree feedback before and after; Level 3 via manager observation and direct report feedback surveys at 60 and 90 days; Level 4 via team-level metrics (engagement scores, team turnover, team performance ratings) at 90–180 days.
What is the difference between the Kirkpatrick Model and the Phillips ROI Model?
The Kirkpatrick Model provides an evaluation framework across four levels. The Phillips ROI Model adds a fifth level that converts Level 4 business results into a financial ROI percentage. Phillips also provides a formal methodology for isolating training’s contribution from other variables. Most organisations use Kirkpatrick for programme evaluation and add the Phillips ROI calculation for major, high-investment initiatives requiring financial justification to senior leadership.
What if business metrics don’t improve even though learning occurred?
This most commonly indicates one of three things: (1) the training addressed the wrong problem — the performance gap had a different root cause, which a thorough Training Needs Analysis would have identified; (2) the work environment does not support transfer — managers are not reinforcing, systems do not allow application, or conflicting incentives exist; or (3) insufficient time has elapsed for behavioural change to translate into business impact. This is exactly why Level 3 measurement is essential — it helps you diagnose where the breakdown occurred.
How do you get managers involved in Level 3 evaluation?
Manager involvement improves dramatically when: they are briefed before training on what behaviours to expect and observe; they receive a simple, specific observation tool; they are asked to provide structured input rather than write a narrative; and evaluation is framed as supporting their team’s growth. Connecting Level 3 results to the manager’s team performance outcomes also increases engagement.
Where does learning analytics fit with the Kirkpatrick Model?
Learning analytics enhances and scales Kirkpatrick evaluation by making it more data-driven and continuous. xAPI-compliant learning systems can track learner behaviour at granular levels for Level 2. Integration with HR systems and business intelligence platforms can automate Level 3 and Level 4 data collection. Analytics does not replace the Kirkpatrick framework — it operationalises it.
Conclusion: From Completion Rates to Real Impact
The central challenge of training effectiveness measurement is not a technical one. It is a cultural and strategic one.
Many organisations measure training activity because it is easy. Counting completions, tallying attendance, and averaging satisfaction scores requires almost no effort and produces reports that look like data. Real evaluation — the kind that connects learning to business performance — requires baseline data, behavioural observation, management partnership, and the organisational will to act on what is found.
The Kirkpatrick Model has endured for more than six decades because it captures something fundamentally true about how training creates value: through a chain from reaction, to learning, to behaviour, to results. Measuring only the first link in that chain — and calling it evaluation — is a practice the L&D profession cannot afford to continue.
Here is your call to action:
- This week: Review your current evaluation approach. Identify which Kirkpatrick levels you are consistently measuring — and which you are skipping.
- This month: For your next significant training programme, build a complete evaluation plan using the template in this article. Define your Level 4 business metric and baseline before training begins.
- This quarter: Establish a Level 3 measurement process for your highest-priority programmes. Brief your manager community on their role in supporting and observing behavioural transfer.
- This year: Move from a programme-by-programme evaluation approach to an organisation-wide evaluation strategy — one that connects learning data to performance data and makes the impact of L&D visible, credible, and continuous.
The question ‘Did the training actually work?’ deserves a real answer. The Kirkpatrick Model gives you the framework to provide one.
Recommended Books on Training Evaluation and Learning Measurement
- Kirkpatrick’s Four Levels of Training Evaluation || James D. Kirkpatrick & Wendy Kayser Kirkpatrick
- Handbook of Training Evaluation and Measurement Methods || Jack J. Phillips
- Return on Investment in Training and Performance Improvement Programs || Jack J. Phillips
- Telling Training’s Story: Evaluation Made Simple, Credible, and Effective || Robert O. Brinkerhoff
- Evidence-Informed Learning Design || Mirjam Neelen & Paul A. Kirschner
- The Field Guide to Learning Management || Elaine Biech & Associates
Further Readings
- Instructional Design Models: The Comprehensive Corporate L&D Guide
- Training Needs Analysis: The Complete Guide for L&D Professionals
- Beyond Happy Sheets: Measuring Real Behaviour Change After Training [Coming Soon]
- How to Calculate Training ROI and Present It to the Business
- Learning Analytics for L&D Professionals: A Beginner’s Guide [Coming Soon]
- How to Write a Training Evaluation Report Your Stakeholders Will Actually Read [Coming Soon]
- How to Design a Training Evaluation Plan Before the Programme Starts [Coming Soon]
- Spaced Repetition: How to Use It for Long-Term Retention [Coming Soon]
- How to Handle Difficult Participants in Training -A Practical Guide for Corporate Trainers
Author Details

Anupama Mitra is a learning experience designer, writer and facilitator with a deep interest in how people learn, adapt and grow at work. With over a decade of experience in corporate learning and development, she specializes in simplifying complex ideas into practical, actionable insights.Her work focuses on leadership development, behavioral changes, making workplace learning more human and engaging. You can reach out to her at anupama@trainercentric.com